Trade Set up on EURUSD, GOLD, GBPUSD, USDCHF, DE30 for 5th- 9th April 2021
Simon Alagbe reviews trade setups for five currency pairs and indices for April 5-9, 2021. He expects the U.S. dollar to strengthen on solid economic data, making EUR/USD bearish with support at 1.17037, and gold bearish with a target around 1,607. He stresses a core rule: never sell indices; buy dips instead, especially on the Dow and DAX.
Chapters
The purpose of that blood is actually when this particular group has been tested before, before it's drawn. Mark that word, it has been tested before, before they draw. Now what we are considering, we have a weak— if this actually have a weak, right, let's assume that this actually have— what we are going to mark as the weak is actually the body of the family, right? The body.
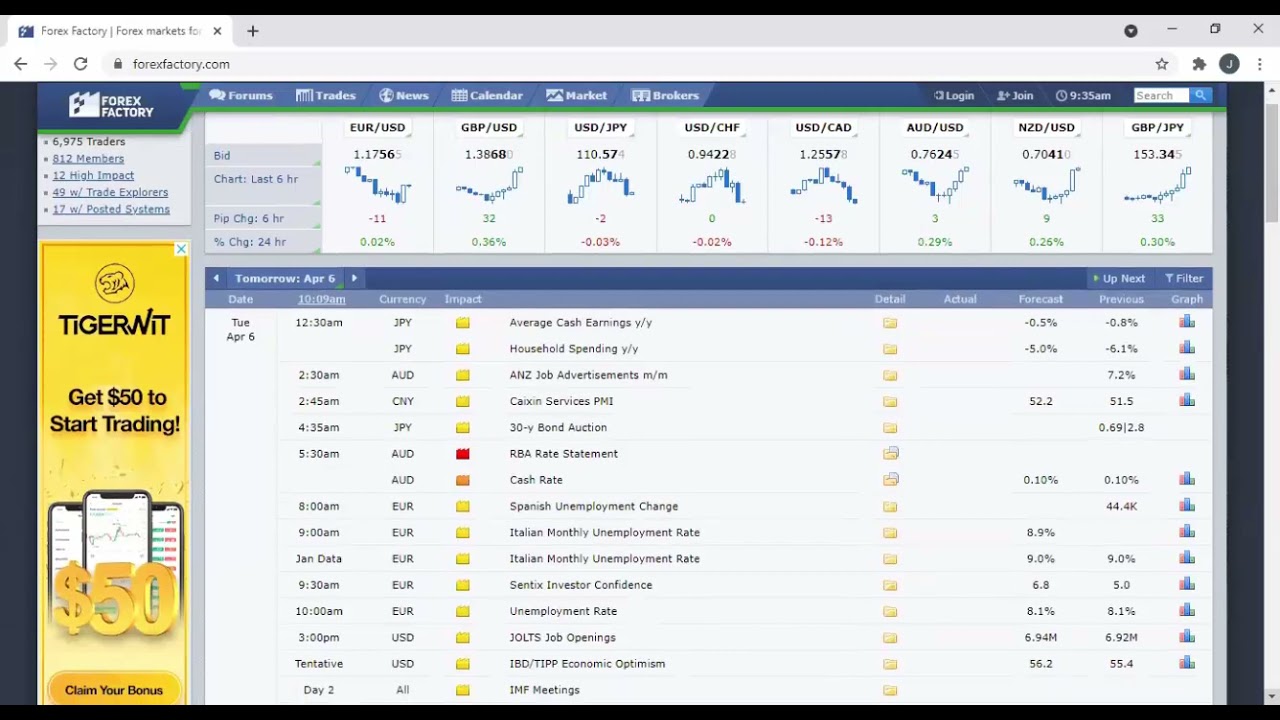
Good morning, everyone, and happy new month and happy Easter. So if you can hear me, let me quickly get our yes in the chat box, and I hope we are enjoying the holiday. It's been a very long holiday since Friday up until this point in time. Happy Easter once again to every one of us, and I believe we are also enjoying the Easter chicken. And the meal for Easter. So I'm using this opportunity to welcome to this week's market review. And let me quickly get check the chat box to see if we can hear me. Okay, so for Mr. Charles, he said yes, he can hear me. Mr. Demon Lido, that's fine. Mr. Francis, Mr. Sunday, Mr. Chidoski. Okay, I might not be able to pronounce this name very well. Okay, I think Mr. Dogor. Okay, um, story of fair. Okay, Madame Miriam, you, you can hear me? That is, uh, very fine. That's good. So I, I'm using this opportunity once again to welcome every one of us to, uh, the Monday Market Review for this week. This is the first week in the month of April, and, uh, this Monday also doubled as Easter Monday, which is a very important holiday, especially in countries that do celebrate This particular holiday. So I think we should give allowance of like 1 or 2 minutes because we have very few participants at this time, just 22, so that others can also join us. Let's just give allowance of 1 to 2 minutes for others to join us so we can start. Okay, we have 23 now. Yeah, maybe when it's 25, then I can start. Okay, so we have 25 participants now. I know, I know others would join us as we continue on this week's review. So I have welcomed every one of us earlier for the benefit of those just joining us, and I wish every one of us a happy Easter. Gradually the holidays are winding up. By tomorrow, everyone will be back at various place of work. But before we start, I will just need to prepare our mind for what happened, especially with the job data released from the United States. That was last week Friday. That was the NFP unemployment rates and average hourly earnings. One came out bad, one came out flat, and one was very, very good for the dollar and Looking at the dollar in the last couple of weeks, we have seen the dollar gain strength against major currencies of the world. And the data on Friday actually confirmed that what we have been seeing, the strength in the dollar, is not just a one-off thing. And we still expect the strength in the dollar to continue for this week, especially as economy— as the US economy continues to open up to business. And restaurants and other businesses that have not been opened previously are also gradually opening up. Which means that we expect employment in the U.S. to continue to grow, and as employment continues to grow, unemployment is expected to drop. And when people are employed, they earn more money, and when they earn, they spend too, which will continue to stimulate the economy, which was the goal of the stimulus bill that was passed by the new administration in the United States. The results coming out from the U.S. is actually showing that the goal of the new administration in the United States to stimulate the economy is gradually paying. The required and then the expected dividend. Hopefully, some of the packages passed in other countries around the world would also give some very good fruits in not so distant future. That's still very hopeful for other economies, especially in the Eurozone where coronavirus has actually continued to put down every effort that, um, government and the European Central Bank has been putting in to get their own economy back on ground. Okay, so for this week, uh, before we would be looking at technical setup of instruments, we need to look out for Forex Factory so that we can have a look at the major economic events we are expecting for this week and how we can prepare for them and how we can utilize the opportunity they are going to present to us. Um, so today, uh, we are going to have a lot of holidays all around the world, especially— we can actually relate with that because we too, we are on holiday in Nigeria, uh, due to, um, the Easter break. So some other countries around the world too are also on holidays, and some of their banks are also closed, which means we are not expecting one of the major participants when it comes to trading. To participate in the market for today. So for some of the countries where their banks are on holiday for today, I will advise us to try as much as possible to stay out from those currencies, uh, especially for today. From tomorrow, everything becomes normal, and then we can start trading any currency of our choice. So like today, um, there is bank holiday in China, so the Chinese yuan will not be a very good one for us to say to trade. Um, Switzerland franc, um, in Europe France and Germany and Italy and only are on holiday. And when you're looking at the eurozone, when you take out these 3 countries from the eurozone, you have nothing, virtually nothing left. So when the major players in the eurozone are on holiday, uh, the best bet is for us to stay out of Europe, especially for today. So from tomorrow to be a very, um, good instrument for us to consider, um, to trade. And then on, uh, in Britain too, uh, there's also bank holiday in Britain for today. So the Great Britain pound would not actually be a very good instrument for us to trade today. So we— although this is going to limit the instrument you can trade, but it's better we stick with those ones that will be available for us to trade for today. And looking at other fundamentals, there's only one medium-impact economic data, that's the ISM Services PMI from the United States. So service sector is not It's also a very important sector in the United States, and the way data releases from the United States has been coming out better than forecast in recent time. So that might also give us a clue as to what we'll be expecting on the ISM Services PMI later today. And because our options are limited, we cannot trade GU, we cannot trade EU, we cannot trade SCHF, we cannot trade USD/CHF. So we have very few instruments left to trade. So USD/JPY, for example, for instance, USD/JPY JPY since there is no holiday in Japan for today. So USD/JPY might be a good instrument to consider for today. An IMF meeting is also starting today. This one is expected to affect all currencies, although in recent times the meeting has not actually affected the currency market so strongly, unlike when banks, heads of banks specifically in some of the countries where we trade their currencies are speaking, or the monetary policy committees of those banks are meeting. Those ones have better influence on the market compared to the IMF meeting. Okay, so we see please, can you give— can you analyze gold, GBP/USD, and USD/CAD? Yes, we are going to do that very soon. But before we look at the charts, that's the technical setup on these instruments, we actually have to look at the fundamentals, because fundamentals drive some of the direction on some of these instruments. When we're able to get the the fundamental reasons behind movements on a particular instrument. What we would be looking out for is now the technical setup to support those fundamental reasons. But we need to start from the fundamentals, be very clear with what can change direction of a particular instrument during the course of this week and how we can key into those directions, um, for the course of this week. Uh, so Tuesday, uh, which is tomorrow So very early tomorrow morning, that's by 5:30 AM, the Reserve Bank of Australia will be releasing their rate statement as well as the cash rate. So cash rate is the same thing as interest rates in Australia, and currently the interest rate is at 0.10%. And tomorrow by 5:30 AM when they are going to release this cash rate, we still expect the cash rate to come at 0.1%. They are not going to increase interest rates yet, and they will not reduce it at the meeting tomorrow. But what we'll be paying attention to is the statement from the Reserve Bank of Australia. What is their view about the Australian economy? For how long do they think they will be able to put together a very good and solid plan to bring back their own economy back on its feet? We can see the rebound in the US economy from data that has been coming out recently. We can't really say the same for the Australian economy. So the Reserve Bank of Australia has a lot to offer tomorrow. They have to give us a lot of insight about their plans on the Australian economy and how fast they think the economy will be able to rebound from the impact of the coronavirus and how they expect to continue to support businesses and individuals who have actually suffered from the impact of coronavirus. IMF meeting still continues tomorrow, but we are not really expecting strong effect from the IMF meetings on the currencies that we trade. So that's why I'm— and if you look at the color of the envelopes, you can see it is low-impact event, so it has actually not been affecting the currency market like other meetings, say the one to be hosted by Bank of England, ECB, Federal Reserve, and other central banks around the world. So Wednesday, it's by 3 PM from Canada, we'll be expecting IV PMI. So IV PMI, those are medium impact, is a purchasing managers' index, medium impact. So if this one could come out better than 62.5, which is the forecast, this will likely lend some strength to the Canadian dollar. And in recent times, the Canadian dollar has actually appeared to be a bit strong compared to other currencies outside of the United States dollar. By 3:30 PM that same day, for those of us that trade crude oil, we'll be expecting crude oil inventory. So recently, due to the surge in price of crude oil in the international markets, we've seen active rigs increase in the United States, which has actually dampened the optimism surrounding the oil markets at this time. Because if you look at oil since the meeting of OPEC+ on Thursday, which actually gave some strength to oil initially, when OPEC+ announced that they will not just rush oil into the market, but they will gradually increase it. So when that statement came out initially, investors saw some positivity in that news. But at a later time, when they had to sit down and then digest that news, that, okay, you said you are going to gradually increase oil production, that means over time the glut we've actually been having in the markets previously is likely going to return back to the markets. And since that Investors have been able to digest the OPEC+ meeting last week. We have seen oil surrendering the massive gains recorded after that meeting, and I'm still expecting oil to continue on that move, especially as investors continue to digest the OPEC+ submission last week Thursday. So crude oil inventory will likely not be very good as it has been, especially since last week has actually not been too good. And we expect it's not, uh, been so good come Wednesday since oil is even still expected to continue to trade lower. But if even if this crude oil inventory comes out good on Wednesday, it's only going to affect the market for some moments because the market will return back to being bearish, uh, for this week. And by 7 PM, the minutes of the last meeting of the Federal Open Market Committee of the Federal Reserve Bank of the United States will be released by 7 PM. So the meeting, uh, gave some— the minute of this meeting will give us a very clear insight into the discussion of the FOMC at their last, uh, meeting. So some very strong move on, um, the greenback will be expected 7 PM on Wednesday. So for some of us and, uh, that trades the greenback, uh, this would be a good time for us to also get some very good pips for ourselves within a short time. 7 PM, uh, Wednesday, good time to trade the dollar, especially because we're expecting the minutes of the last meeting of the FOMC. So the only, uh, major event on Thursday will be the speech by the Federal Chair, uh, Jerome Powell. So Jerome Powell will be speaking 5 PM On Thursday, and since he's the head of the Federal Reserve, his speech would is expected to cause a lot of volatility, especially on the US DPA. So on Thursday, five p.m., let's be on the lookout for the speech by the Federal Chair Jerome Powell. And on Friday, we have two high-impact economic data from Canada. But before then, by 2:30 AM. Although 2:30 AM might come too early for those of us in this part of the world, but for some of us that might be awake at that time, we can utilize the opportunity by trading the RBA Financial Stability Review. So this one will be conducted— is a financial stability review conducted by the Reserve Bank of Australia. So they will be making available their review of commercial banks in Australia by 2:30 AM on Friday. But the one I would encourage us to look forward to will be the data expected from Canada, employment change and unemployment rates. These 2 data usually comes out with NFP that we saw last week Friday, but for this month, um, the ones from Canada has been shifted a week forward. That's why we'll be trading these ones this week Friday. So employment change and unemployment rates, they're expecting employment to have grown in the— in Canada by 90,000. So if you go above 90,000, will be seen as being very good for the Canadian dollar. But we are also expecting unemployment rate. So this one has been adjusted slightly lower. The last time this data was released, it came out at 8.2%. But this time around, the forecast is 8.0%, which means from the view of economists, they feel Canada has been able to reduce unemployment a little bit from the last time this data was released. So if Unemployment rate can come out any, um, any figure lower than 8.0%, because this is— that will be seen lower than the forecast and even lower than the previous time that particular data came out. That will be very, very good for the Canadian dollar. But the best situation for us to trade this news come Friday will be when Canadian dollar— these 2 news expected from the Canadian dollar comes out good. Or the two comes out bad. If the two is mixed, then we might expect some misreaction on the Canadian dollar pair, and that might not be so good for us as traders. So it's better we look out for it when the two comes out in one particular direction, either good or bad. Once it's mixed, we stay out of this expected. job data from Canada by 1:30 PM on Friday. And I still want to remind us, for some of us that are just joining up, uh, with the market review for this week, uh, for today, um, today there are some holidays around the world, especially as we are also celebrating Easter Monday today. So some other countries around the world are also celebrating holiday today, and it is advised for us to stay out of the currencies of those economies for today. Tomorrow we'll return back to trading them as well as other currencies available on the platform. So if you have any question at this point, you can quickly drop your question before we look at, um, the technical setup on some instruments. So any question on the fundamentals that you have checked? Okay, so Mr. Godwin is asking that does this timing correspond to Nigerian time. Yes, uh, we've been able to adjust the time on the website to Nigerian time. Okay, so Mr. Moshu, they say that D30 is not moving at all. Okay, it seems Mr. Moshu joined us a bit late, uh, because the banks in Germany are also on holiday today. So even if the stock market— and the stock market is also expected to be closed. Yes, basically it's because of the holiday. Because of the holiday. So even if the market is moving, you will not expect the kind of move you would see when banks are up for business, because banks account for a large percentage of the volume that is being traded in this market. When those volumes are out, you expect movement to be somehow slow, and even if there's going to be movement, it's going to be more erratic than it would have been On conventional days when banks are open for business. Okay, Mr. Steve, how do we access all this news? Okay, just for us to check forexfactory.com. So on forexfactory.com, you would see all this economic data that I've just been able to share with us. Um, now forexfactory.com. So I've just dropped the address in the chat box for every one of us, um, to have a look at it. Do you have any other question before we move to the chat? Okay, so let's move to the chat now. I hope you can all see my screen. Yes. Okay, I think so. So just as I've said, Okay, so Mr. Latu, you say what happened to D30 going one direction? Um, the stock markets, uh, benefited hugely from the job data released on Friday, even though over time— when we get to D30, I think I have to show us that, um, the charts, and then we look at it. And then we see why it is good for us to only look out for trade opportunity in one direction on the stock market. I'm going to show us that when we get to the stock market, especially maybe it's the effect we examine first. I will show that to us at that point. Okay, Mr. Francis said you cannot see my screen. I think I'm sharing the screen now. Who else cannot see my screen? Okay, okay. So thank you, thank you, Mr. Francis. You can see the screen now. That's fine. Um, so one of the countries or one of the regions on holiday is the Eurozone for today. Um, so because of that, we are staying out of EUR/USD for today, but that will not deter us from running analysis on what we expect for the week. Uh, so for the dollar, we have actually seen the dollar gain massive strength against the euro in recent time, and we can see that on the charts. EUR/USD has actually been, um, moving down, um, on to the downside since around December, late December last year. Yeah, we can see on the daily charts that EUR/USD has been moving to the downside, which has actually shown, um, the strength of the dollar in that particular time under consideration. So that strength is still expected to continue, uh, for today despite Some little retracement witnessed last week. That was on Wednesday and Thursday last week. So this pair retraced from around this support. That was last week Wednesday and then on on Thursday. On Friday, due to the good data released from the U.S., that's the nonfarm payroll, nonfarm employment change coming out very good, showing strength in the job markets in the United States. So that's particular data is expected to continue to push, um, the dollar to the upside. So the dollar is expected to continue to be strengthened for this week, which means we are expecting EUR/USD to come back and retest this support this week. And the support is at 1.17037. So I see EUR/USD coming as low as that price for this week. If not for thin trading expected for today, I would have seen, uh, or I would have suggested that we would see EUR/USD get to this price level level today. But if not today, during the course of this week, we are going to see a comeback to retest 1.107037. But I'm not going to share with us any trade opportunity on it because, um, there is, um, a holiday in the eurozone for today. So, and I want us to stay out of EUR/USD due to the holiday. But for this week, okay, Madame Marion says she cannot hear me. Uh, let me quickly Type a response in the chat box. Okay, so I— for those of us that couldn't hear me, so I've actually typed a response in the chat box so we can look at that response and then connect audio device to, um, to the application so that we'll be able to hear me. Okay, so what I was trying to, uh, explain the last time was that, um, EUR/USD has actually been on a downtrend since late December. So you can see that on this, um, daily chart. Then on Wednesday last week, it rebounded from around a support at 1.17037. So from that rebound, um, was also witnessed in the markets the next day. That was on Thursday. But we saw the market returning back to the prevailing direction in the market, which is the downtrend, when job data from the United States confirmed that the job market is gradually picking pace once again in the United States, and the economy is gradually returning back to normal because jobs are gradually being created in the United States. And so because of that, I expect Euro/USD to trade BH for this week, and I see Euro/USD coming back to at least 1.17037. And because 1.17037 is a support that has rejected price, um, in recent times, so it's not just going to be a walk in the park for Euro/USD when it gets back to around this price level. For so— for anyone who is taking a sell position on this instrument would have to take his or her profits before 1.17037, and then once it gets back to 1.17037 You wait for reaction on this pair around this level. So if it's able to go lower than this price level, then the sell on this instrument is further cemented. Or we can just wait for it to go lower than 1.17037, or we can have a sell stop below 1.17037. But one thing is also expected, even though we expect EUR/USD to it did this week. So even at the point where it crosses below 1.17037, we should not just jump into a sell trade immediately. We should wait for it to retest this region. So when it breaks below, um, so assuming this particular candle is able to go lower than, um, although this is not just that zone, um, I only have to put a line to represent that particular zone. So if it breaks below this particular zone here We have to still wait for it to retest this zone. So like the last time we had a break, uh, where was that? Can I see that on the charts? Okay, so, um, so once it breaks, let's just wait for it to come back and then retest 1.7017037. before we continue the sell on the instrument, even though we are looking out for sell opportunities on EUR/USD, uh, for this week. Yeah. Okay, so on the hourly charts, we can see that the instrument is currently struggling with a weak support around this level. That's around 1.17408. I'm expecting this instrument to break below this support in no distance time. So very soon, it's actually going to do that. But because of the thin liquidity we would be witnessing on the euro for today, I've told us let us stay clear of EUR/USD for today. So let's stay clear, but we still need to look at the chart for us to have an idea of how to place trade for this week. Okay, so then we move to oil. So for oil, I, uh, from what I explained earlier on, so I expect oil to be bearish for this week despite the rebound we are gradually witnessing in the economy of the United States. The glut is— glut in the market is expected to gradually creep in back into the oil markets due to the last decision made by OPEC and the plea by the Biden administration to Saudi Arabia that they should try as much as possible to keep the cost of oil as low as possible. That is becoming too expensive for some consumers. So that's, that's actually going to weigh on the oil markets, meaning we'll be looking out for opportunities to sell oil, uh, for this week. So oil, we'll be looking out for bearish move on this instrument for this week. And okay, so on the hourly chart, you can see that when this instrument got to around this resistance region, uh, which is around $65, $65.11, that's actually been trading lower since then. It's actually been trading lower and lower. And around this price level was when OPEC made the decision last week. So oil was trading around $62.60 as of last week Thursday when OPEC decision was made public. And after the decision, it soared to around $65. And after digestion of the decision of OPEC investors are actually coming to terms with, um, the decision of OPEC that even though they said they will gradually increase, uh, oil production, but it means supply to the market will be going up. And when supply continues to increase, price will— without an adequate compensation coming from demand, we expect price to trade lower. So that's what we have been witnessing since investors were able to digest, um, the statement made available by OPEC at the meeting, uh, At their meeting last Thursday, so we expect oil to continue to trade bearish, at least to get back to the price as at the time the decision was made last week, which was $62.62 in the interim. And once it's able to break lower than $62, I see oil going back to around $61 during the course of this week. So we should be looking out for opportunities to sell oil for this week. And because of the holiday too, we might actually still stay out of oil for today, but from tomorrow let's start looking out for opportunities to sell oil. So this is US30 on the daily chart. Someone asked a question when I was looking at the fundamentals that was on forexfactory.com that Why has D30 specifically been moving one direction? And I said anytime I get to the index, I'm going to show something about the direction, the general direction on the index, so that we can have a hint as to the best way and the best trade to always look out for on the index. So let me move to the monthly chart to show us. Um, what I had in mind. Uh, so this is, um, US30, for instance, on the monthly chart. So looking at this index, or looking at this instrument since around September 2011— so around September 2011, US30 was trading at, um, 10,499. So imagine someone placed a sell trade As at this time, just imagine. And US30 is currently trading at 33,236. 33,236. But let us look at it in another way. Imagine someone placed a buy since this particular day and forgot about the trade, and it's just opening up the charts now. How do you think that person is going to feel looking at Um, the profits that would have accumulated on that particular trade. I'm actually showing us this for us to have an idea as to the best trade to look out for on the index generally. Even though we had coronavirus affecting the market massively sometime last year, so this was the impact of corona. So by now Corona is no longer in the markets. Despite this very strong bearish force in the markets due to Corona, the market has rebounded and has recovered all lost ground due to Corona. So this is suggesting to us that anytime we are trading the stock market, anytime we are trading the index, we should be looking out for opportunities to buy. We should desist from placing sell trades. So even if it is crashing if you witness the stock, um, or the index crashing, you should not sell. So like, as at this time on this chart that I saw, it's, um, trading lower from around a resistance, you smile because it is going to present you an opportunity to catch more move to the upside when it eventually goes back up. So anytime it's coming down, don't sell, just wait for opportunities to buy. Even if it sells for 3 consecutive days, don't sell. Just wait for opportunities to buy because on the long run, the direction on the stock market is the upside. It's the upside. It will continue to surge higher, continue to surge higher, continue to surge higher in as much as companies continue to be innovative and they are coming up with products that individuals will continue to buy. In as much as that continues to happen in the market, Then the stock market, especially the index, will continue to surge to the upside. So we should desist from this moment, um, on selling US30, DA30, US100, all of them together, all the indexes. So let us desist from placing a sell trade on them when they are selling. Let us wait, wait out the period of selling on these instruments generally. Just wait. Wait for it to start buying, then you buy, and you see yourself making more money than trying to sell at every opportunity when this market is trading lower. Okay, so Mr. Modulu is asking that does this same rule hold true for currency pair? Not really. For the currency markets, the currency market does not operate like the stock market. So the currency market is different. If I turn to a currency. Okay, so Mr. Waleki, okay, let me conclude answer to Mr. Modulu's question. The currency market does not hold through to this analogy because there is no currency you are going to, apart from maybe NGN/USD, that you can check over a period of time, and maybe USD/TRY, and that's also an exception, that you can see a particular instrument going one direction for more than 5 years. It's extremely rare, extremely rare in the case of currency because currency usually swings in both directions. Currency goes up, comes down, goes up, and then comes down. That's the conventional move in the currency market. So for Mr. Wale Q, he said, why not sell and rebuy when the direction change? I just showed us something on the monthly chart. I think— have I removed Um, the line I drew. Yeah, so I just showed us, um, a particular price as at— that was even as at 2011— that, um, US30 was trading at 10,499. Let us imagine someone was caught on a sale at this price level. How long do we think this person is going to wait for this instrument to come back To 10,499, where it is currently at 33,233. Even though nothing is impossible, it can happen, but it's going to take a long time for this to happen, to crash from 33,000 to 10,000. It means the whole economy of the world has crashed. That's what can bring this from 33,000 to 10,499. So that's why, for us to be on a very safe side, Do not sell. Even if you place a buy trade and it is not currently going up, if you have enough capital to hold on to your trade, you will eventually make money on that buy. Even those that placed a buy trade as at the inception of coronavirus— this was, uh, when the lockdown seriously affected the stock market— the price crashed from around 29,437 to around 18,000. That was a massive crash. If the person had enough capital to hold on to this sale, by now the person has made enough money from that trade. That's the power of being on a buy compared to when you are selling. It's dangerous placing a sale, uh, on the index. Very, very dangerous. Extremely dangerous. So it's better we start looking out for opportunities to buy them rather than placing a sell on this instrument, um, generally. Okay, so for US30, US30 will be a good one for us to trade for today since banks in the US are not on holiday today. Um, so we have this instrument trade within this bound that was, um, last week, and, um, the job data was able to help us push it above 33,129, which was a very good one for us, uh, for some of us that might be trading, um, this instrument. Let me quickly check, um, what, um, Hybrid— the direction Hybrid is giving to us on this instrument. So yeah, okay, so, um, Hybrid says we can buy. So at this point, let me move to 15 minutes and see if there's a current buy opportunity. The last time we got the buy signal on 15 minutes, uh, was 1st of April. So it's— it has actually traded, uh, for some time now. So we, we just need to wait for this instrument to show us a signal to sell first. So it's going to sell momentarily before we get another signal to buy. So at any— at the point where we get a signal to buy At a later time, then we can have a buy trade. So let me go back to my normal charts. Okay, so now it's also trading within this bound at this time. So within the resistance equal to that was as a result of the NFP data last week, 33259, and then we had some retracement to around this level, that's 33189. Then then another weak support at around this price, that's 33151. So there is a possibility, um, today that US30 will come to retest one of these 2 supports, either 33189 or 33151. It's going to retest one of these 2 before it continues, uh, trading to the upside. Or we can just wait for it to trade above 33259. So once it trades above 33259, then we can have a buy trade from 33259 and continue to enjoy, um, the move to the upside on this instrument. Okay, I think I'm having some questions in the chat. Let me quickly check them. Um, how much balance should I have to be able to trade on stocks? Okay, so for Mr. Franklin, um, he's asking that how How much should he have to be able to trade on stocks? Well, for one to be able to trade comfortably on some of these instruments, especially the index, it would be good if we can have some few millions in our trading accounts because that will afford us the opportunity to really enjoy the ride, not just taking small, small money on each trade. We'll be able to enjoy the ride on it. But once you can, even if you don't have a million, once you can try to make it up to, let's say, $500, uh, it should be fine. You can start with $500. Yes, Mr. Franklin said millions. Yes, millions. That's what will give us the opportunity to really enjoy it. Because when you look at the average trading accounts of, um, some of these foreign traders we follow, um, some of them have on average $100,000 in their trading accounts. And when you take that to naira, you know, it's running into some millions because it is at that point When you have some of those millions like that, then we really enjoy the movement, um, in this market. But since we still have some small money, we can still grow our small money to some of those millions, uh, some of those guys are already working with. I hope I'm able to answer your questions, uh, uh, Mr. Franklin. Okay, so for Mr. Moshood, he's asking that how can he have access to the hybrid, um, indicator. So you, you can actually reach out to your account manager tomorrow Um, so your account manager will get it across to you. You can send a mail to feedback@rally.academy, feedback@rally.academy, or you reach out to account manager at, um, Rally Trade. So you— the, the, the strategy will be sent across to you. Okay, so we sign up and say we should do an analysis on US 100. Yeah, what I've just done on US 30 is also applicable on US 100. We should be looking out for opportunities to buy. So it's like a commandment, thou shalt not sell. So that's just a commandment on the index. Try as much as possible not to sell, no matter how enticing, how sweet, or how good, um, sales appear. Do not sell. Okay, so how do we scalp? It's better you are scalping on a buy. Do not scalp selling. It's the same principle. Just try not to take advantage of sell opportunities. Try to stay out of sells. If you do that, you will discover that you are doing pretty well on your trades. And that's the beauty when you are doing very fine on your trades. It's the beauty of trading. When when are we adding more indices to the stock? When are we adding more indices to this market watch? Yeah, some other index were added recently. Just need to check your market watch. You right-click and you select show all. So some new index were added recently. I think about a month or two ago. Okay, um, Satyajit said he sent a message to rally dot trade for some indicators or to no avail. Okay, just let me drop the email we are going to we can work with. So feedback at rally dot academy. Uh, because Rally Academy is the education arm of the company. Feedback@rally.academy. Okay, or you reach out to your account manager. So any of the two is going to work. Okay, from Mr. Ayodele, can one see 1-hour timeframe analysis for the index? Very well, you can, you can, even based on the kind of capital we have. have. 1 hour 30 minutes are the best time frame for us to work with. Okay, for Mr. Abdullah, since the same principle for US30, US100 applicable to D30? Yes, the same principle is applicable to all of the index apart from very few ones, and maybe from countries that are not as developed as maybe United States or Germany, even Yeah, most apart from very few countries that are not as developed where their stock markets are struggling. So those that have established, well-established stock markets, it is better we are looking out for opportunities to buy them. And since we are not trading some of those developing market stocks, so it's better we are looking out for opportunities to buy on these few ones that we trade: US 30, US 100, E30, US 500. And the likes. I think we spent some time on US30. So the next one is D30. So if you also look at some of the charts of D30, so let me quickly run to the monthly chart on H2 and then show us something similar to what we saw on US30. Even though the move on D30 was not as sharp as what we saw on US30, but still pointing to the same direction. Upside. So it's also upside. So every time this market sells, it is creating opportunities for us to buy more and make more. So that is the way we should start seeing sales on the index. Every time it sells, it is creating opportunity for us to make money, to make more money buying. Let me put it that way. Um, so for D30, let me move to the hourly time frame. So we just see D30 also continue the bullish move, um, as a result of the positive non-farm employment change data that came out from the United States that was on Friday. So that's actually brought some optimism back to the stock market. Well, I'm still expecting this one to, to have some minor retracements because it cannot just continue to surge higher this way. So some minor retracement is expected from around where it is now, even though we are not to say sell. You should not forget that we are not to sell, and it's better we do not trade the E30 today because there is bank holiday in Germany today. But I'm just trying to show to us how to trade it for this week. So we are not to sell even though we are expecting some retracement from around, um, the price where it's trading at, at this point in time. It's going to retrace, uh, from that price level. Then after the retracement, it continues to the upside, but we are not to We should not forget that commandment. Uh, maybe to get to, um, around this weak support here, that's at 15,128. There is a likelihood to retest 15,128, then from 15,128 it continues, uh, the move to the upside. Or we wait altogether for it to trade above 15,204. So we have 2 options: either we wait for it to come back, retest 15,128, then we buy from 15,128, or we just wait, let it retest, and then continue to go up, and we buy from above 15,204. So Mr. Ayodele said it doesn't have support and resistance. I'm not also using the indicator. I am not also using— although I have it, but I'm not using support and resistance indicator, um, at all. I've not used it today at all. I'm only picking out those resistance that price is given to me. That's what I've actually been doing. But if you need it, you can just send a mail to that email address I gave to us earlier. That's feedback@rally.academy. Or you can reach out to your account manager. Any of the two is going to work. Any of the indicator you need, you can, um, any of the indicator we make available to our clients that you need, you can reach out to that email or to your account manager. So Mr. Suleiman is raising up his hand, so you can actually ask Um, your question in the chat box. Okay, I think I've seen your question now. Please, what is the best time frame to use when trading fundamental? Well, that's— this is a very good question, uh, Mr. Suleiman. One good thing about fundamentals is that fundamentals does not deal with the charts. So irrespective of the time frame you have tuned your chart to, what is important is are you able to analyze the market? Are you able to analyze the events properly? If yes, place a trade according to that, your analysis, because fundamental does not respect support, does not respect resistance, does not respect moving average or any of those technical indicators that you might be aware of. So any time frame works, but based on our capital, you can just put your charts on anything between 5 minutes and 1 hour just to have a very clear view of where the instrument is tending towards, especially the currencies. But for the index, no matter the fundamentals, let us just try not to sell them because it only requires one slightly good news to return them back to the upside, which is the trend on them. Okay, so for D30, I think we've been able to do justice to that. Okay, so the next instrument we'll be looking at now is gold. Due to the strength in the dollar, we have seen gold surrendering some of the strength that it gained last year. Since around early this year, we've seen gold trading to the downside, trading to the downside. And 2 weeks ago, gold got to a low around 1,677, as shown on this chart. Gold traded to as low as 1,677. That was, I think, 2 weeks ago. 2 or 3 weeks ago. Yeah, 2 or 3 weeks ago, gold traded around, um, that low. And, um, last week gold was able to surge to around this high, that's $17,053. Even though I'm expecting gold to continue to trade to the downside, yes, because the dollar is expected to continue to appreciate in value due to the positive data that has actually been coming out from the United States and the optimism generally among investors towards the U.S. economy that the U.S. economy is able to recover faster than they expected. So that's faster than expected recovery that data released from the United States is gradually showing us means we're expecting the dollar to continue to be strong, especially against, um, the major currencies. And that is expected to weigh on the price of gold, because when dollar is strong, it makes gold more expensive for holders of foreign currencies. And when that happens, we expect gold to trade to the downside. Okay, um, so, uh, it traded to as high as $17,053. That's the highest, uh, in the last 3 weeks, um, on gold. Then, um, last week gold was able to also make, um, or to match a high at 17,033. That was on Friday, uh, last week, despite the positive job data. So it was still able to surge as high as 17,033. So from this, 17,033 also coincides as a local resistance on this instrument, even though the resistance is a weak one. So Because we are looking out for opportunities to sell gold and it is trading around a local resistance at 17,025 now, local resistance at 17,033. So I expect gold to continue to trade bearish to around 16,077 for this week. Um, so from where gold is trading now, we should be looking out for opportunities to sell gold till 16,077. And 77.07. So below that region, we should try as much as possible to close, um, our trades on sell. Okay, so this one is currently giving us a signal to buy, but because we know we are not expected to buy gold, um, so we are going to, uh, do away with this signal, um, currently appearing for a buy, even though the signal is not currently valid because, um, the histogram is currently red, which is contrary to the EMA cross signal, which is saying buy, even though the MACD is also saying we can buy. But because the histogram says no, we cannot buy yet, so it's actually not favoring a buy, even though the signal says we should buy, but it's not yet confirmed, so we don't buy gold for now. Okay, so Mr. Innocent— okay, Mr. Wisdom says we should do a demand and supply zone webinar. Okay, um, thank you for your suggestion, um, Mr. Wisdom. Maybe one of these days we'll actually look at offering our clients a training on support and demand support and resistance, or what you call demand and supply zones. I guess what you are doing is a better way, but how can we detect the supply, the support and resistance zones by ourselves? Ah, okay. And for some of us that might not be able to identify some of those zones ourselves, we can just use the, um, the, the indicator we have actually made available to our clients. So if you don't have access to it yet, you can reach out to your account manager or you send a mail to that email address I dropped earlier. That's support. That's feedback at rally dot academy. Feedback at rally dot academy. So Mr. Audix, you are raising up your hand. You can drop your question in the chat box. Mr. Wisdom is also asking about Vokes. That's a volatility index. Okay, uh, maybe if time permits, because it's even almost 11 o'clock and I'm not done with the instrument I have open to analyze. So it's almost 11 o'clock and we ought to have ended this analysis by 10:30. So I'm not sure there's going to be time that will be sufficient for us to run an analysis on Vox, but you can send, um, email to feedback@rally.academy, uh, Mr. Wisdom, so, um, so I can look at sending a personal email to you so I can respond to your email. So feedback@tradingacademywisdom, you can ask your question via that email. Um, 12,922.19 is my current position on US100 and I am on a loss with a 0.01. Is there a possibility of a sooner sale? Wow. Wow, okay. So Mr. Innocent, I actually understand because you, you've not actually joined this today's webinar at the time you initiated the sale. But from this moment henceforth, I will advise us not to sell them. So I will advise us not to. I will quickly look at it. You say US 100, you have US 100 chart opened, um, so because you have a trade running on it, let me just check. On US100 and see if— and look at the price level where you entered the trade. US100, so the trade was at 12,000. Wow, wow, wow. 12,922. 12,922. That was 12,922. 22 is around— you have had a sell trade around this level. This is even 991. Um, so for US100, as you can see on the charts, it also attained a high that was on Friday due to that positive, um, non-farm employment change data from the United States and rebounded from around this support earlier this morning. So we can see it come back to retest this broken support at 13,306. Before it continued this move. Uh, well, as at this region where US100 is trading now, even though it has retraced from around that region, um, not too long ago, so I still expect something similar to happen, uh, at least for now, even though if it's going to eventually break, um, this later on. So it should retrace briefly from around that particular zone But considering where you entered this, this trade, uh, this is, uh, quite a distance from where price is currently trading. So let's just hope US100 can come, uh, below this price level. That's at 13,306. If it does, then you can have a, a hope that, um, US100 can still get to around this level. So if it gets around this level, you can take it off. Yes, once it gets to 13,000, but that's only possible if it breaks 13,306. So once it breaks 13,306, so you can adjust your TP, um, your SL to 13,184 once you see it break below 13,306. But that's dependent on it not breaking 13,382, which looks more possible than breaking 13,306. But we can still witness some retracements that might take it as low as 13,184. But for 12,991, um, I can't see that currently in this market. I can't see it currently, um, on this instrument and in this market. Okay, so this is, um, Australian dollar, um, against the US dollar, um, on the daily time frame. So we see these instruments trading around a strong support. There is a strong support around this price level at 0.75771, even though we, we have seen, um, the US dollar gain strength against the Australian dollar in recent time. But over a period of time Over a period of time, you have seen the Australian dollar showed some massive strength against the USD because the Australian dollar is a commodity-supported currency and most of the exports from Australia goes to China. And China has shown more signs of recovery, much more than the United States. So Australian dollar is also expected to gain some strength as a result of the recovery of the Chinese economy. So that's why the Australian dollar has not lost so much ground to the US dollar compared to euro or some other currencies like the Japanese yen, who has actually lost much more ground against the US dollar. So because this instrument is currently trading around a support, despite the expectation that the US dollar is going to be strong, So for for the Australian dollar and New Zealand dollar, I'm going to be taking a different direction on this instrument. On these two instruments, I'm a bit neutral on the two of them because there are some other information that that drives these two currencies that is beyond just the strength of the US dollar. So the strength of the of the Chinese economy drives these two currencies, the Australian dollar and. The New Zealand dollar. So for on this pair, I'm going to be neutral. But in as much as it doesn't go lower than 0.75771, that's a much a much stronger support. And then there is another support here at 0.75348, and there is a local resistance at. Around this level at 0.76315. So I still expect, um, Australian dollar to trade as high as 0.76315, um, in the first instance. And anything that happens around 0.76315 will determine the direction on this instrument, which is likely to the upside. Is likely to the upside than to the downside. So it's better we look out for opportunities to buy AUD/USD for this week. So it's likely going to break above 0.76315. Um, so the same thing can also be seen on, um, New Zealand dollar against the US dollar. So we— I see expect this to, to trade to the upside, although one good side there is a clear bullish sign on NZD/USD. So we had this rejection here, and then we're able to see this one close above this first rejection candle we have here, even though we saw some rejection to the upside. But since this rejection to the upside, we have seen other candles continuing to trend to the upside, showing to us that this is where this instrument wants to tend to. It wants to trend to the upside. So for NZD/USD, just like AUD/USD, uh, we should be looking out for opportunities to buy them. Should be looking out for opportunities to buy those 2 pairs— AUD/USD, NZD/USD— opportunities to buy. Um, USD/CAD has actually been trading to the downside. Um, I think, okay, this is the daily chart, so you can see that, um, since around mid of December, that's around 18th of December, has actually been gradually, gradually, gradually trading to the downside. So despite the strength of, um, of the dollar, so we've seen USD/CAD trading to the downside and, um, around a local resistance here. There's a local resistance around 1.26419. Uh, we saw this rejection on this instrument, and the next candle happened to be a bearish engulfing around a local resistance. That's a strong bearish signal, and the next candle was also able to close below that bearish engulfing. Even though we've had some recent surge to the upside due to the NFP data that came out on Friday, but this instrument is returning back back to the right direction, which is to the downside. So USD/CAD opportunities to sell, uh, for this week, you should be looking out for opportunities to sell. So once it breaks below around this local support on the hourly charts where it's trading now, which is, um, 1.25556— 1.25556 is a local support on USD/CAD on the hourly time frame. So once it's able to trade lower than that zone, uh, we can have our first target or USD/CAD at 1.25403. That's the first target. And the second target at 1.25276. I think I'm having some questions in the chat box. Let me quickly check. Uh, and it's already past 11. Um, when will the Bollinger Band webinar be concluded? Okay, uh, we are going to discuss that, and then we'll get to know when, uh, very soon. And then, please differentiate between stop loss and stop limits. Stop loss is a stop order. Stop loss puts an end to your trade, uh, while the stop limit is a type of pending order. So they are not the same thing, even though Even though the two contain the word stop, one is a type of pending order while one is a type of stop order. One stops trade, one initiates trade. Stop loss stops a trade. Stop limit initiates a pending order. Mr. Wisdom, okay, that's fine. Thank you very much, Mr. Wisdom. Mr. Tammy, okay, so I will note your. Email. I will note your email, Mr. Tamin, for your request. Okay, so for USD/CAD, I think we are done. So EUR/JPY, um, so EUR/JPY is actually showing us that the Japanese yen has actually been weak, and the weakness can also be seen if you also turn your charts to USD/JPY. But there is a very key zone where EUR/JPY is trading at this point, and if you also look at USD/JPY, it's also trading around a similar zone to where EUR/JPY is also trading. So there's a local resistance at 130.296, even though in recent time we've had had EUR/JPY trade as high as 130.657, but recently this zone, 130.317, has not allowed EUR/JPY to continue to the upside. So for this week on EUR/JPY, I'm expecting the Japanese yen to recover some of the lost ground, not just against euro, even against USD. I'm expecting it to regain some of the lost ground because it has actually moved or turned towards one direction for a very long time, for a very long time. So that's, that's, that should be giving us the opportunity to consider, um, a change in direction on this, uh, instrument. Okay, so let's look at some GBP/USD. So for this instrument, because it has not been able to go above the zone where it's trading now, that's 130.317, in recent time, and the highest it has gotten to, uh, recently is 130593. It is good for us to start looking out for opportunities to take sell trades on this instrument. So sell positions will be the best trade, um, to consider on this instrument. Okay, so you can also see it on the 4-hour time frame. So it's also showing us signs of this instrument gradually tending to the downside. So trades to the downside will be the best. On this instrument for this week. Trades to the downside, trades to the downside on EUR/JPY for today and for this week. Okay, for today we might stay out because of the holiday in the eurozone, but from tomorrow let's start looking out for opportunities to trade EUR/JPY to the downside. Uh, for GBP/USD, um, GBP/USD has actually nullified just like AUD and NZD, has actually nullified some of the strength we have seen in the dollar in recent time. This is due to the way Britain have been able to manage coronavirus. The vaccine administration in Britain is one of the best, so they have actually done a good job, which means gradually we'll be expecting the economy of Britain to be opened up the way it was very, very— the way it was before coronavirus very soon. So that's also showing to us that pound will likely not lose ground to the dollar for this week because it's the way they have managed the economy with respect to coronavirus is second to none around the world. And since it traded to around this local support at 1.36686, Since it traded around that local support, we have seen it rebounding from around that level. So that rebound, I expect it to continue, especially due to this signal we saw here. This was able to engulf this bearish candle we have here, and then this closed above it, and since then has not actually looked back. So since it is not looking back, we should not also look back by looking out for opportunities to Take buy positions on GBPUSD. So a buy to around 1.39880 will be on the card for this week. I'm taking 1.39880 because there is a local resistance around that price level. Oh, okay. I see I have some messages. Let me quickly check. And we need to round up, say, in the next five minutes. Okay. Um, okay. So that's um GU for USDJPY. It's going to look similar to EuroJPY. So you can see it. USJPY has actually been trending one direction for a very long time, and it's pretty rare to see a currency trend this way for a very long time. But one good thing is that this instrument has actually, is actually giving us a sign that it has gotten to a peak, a peak at around 110.960. So since it got to 110.960, We've seen it gradually retreating. It's been retreating gradually from around that peak, so which is actually a signal for us to to start considering opportunities to take trades to the downside on USDJPY. And one of the instruments that will be safe for us to trade today is USDJPY. So one of the instruments because there's no holiday in in the two countries. Um, today. So it's one of the very safe instruments for us to take trades on for today. Um, so we see trade within here and here recently. Yeah, so it trades within this bound recently, that's 110.716. But since it got to this high at 110.960, it has not been able to go as high as this price level again, which means we start looking out for other levels below 110.960 for direction or for clue on this instrument. So for now, because it's very close to around this local support, 110.575 to 110.519 is where we have this local support on this instrument. So anyone who— let me see how many pips to the support now. 1.5. It's just 5.8. That's pretty small. It's not up to 10 pips from around the first local support. So let's just wait for, uh, USD/JPY to trade lower than 110.519. So once it does that, then we would be looking out for the next support, even though there is a local support around this level. And then that's the first level, then the next level here. So we look out for these levels on USD/JPY. So So, uh, first break below 110.519, then we target first 110.375, then finally 110.183. But for USD/JPY for this week, let's be looking out for opportunities to take sell trades on these instruments, opportunities to sell. Yeah, so USD/CHF is also giving us a similar pattern to what we saw on, um, USD/JPY. The only difference on USD/CHF to USD/JPY is that after this, the, the instrument attained a high at 0.94720, we've been having some other smaller candles tending towards the overall direction This one is not giving us a clear confidence that USCHL will be tending downward for this week. There is a possibility that USCHL will will retest this high at 0.94720. So for USCHL, it will likely retest 0.94720, and maybe the next retest can now lead to the instrument tending to the downside. But for this instrument, we'll be looking out for opportunities to buy for now since it's not giving us a clear sign to take, uh, um, a sell yet. So we should not look out to sell USD/CHF yet, but we still need to wait since it's pretty close to this local, uh, resistance at 0.94363. So we need to wait, break above 0.94363. Yeah, so the course will be clean Clear for us to take a buy trade up onto at least 0.94720, and we can have our stop loss below these zones. We can see these zones here. Yeah, so we can have our stop loss below these zones. So we can make it a longer-term trade than our usual trade. So we can have our stop loss at 0.93998 on the buy once it trades above 0.94363 to target 0.94720. And stop loss 0.99933998. Okay, I think this should be the last instrument. That's euro GBP, euro pound, euro pound. So the pound has actually shown to us that euro is extremely weak, and euro has been weak due to the way eurozone has managed the vaccination program in their zone. There is no country in the eurozone that has managed the vaccination Pretty well. All of them have been struggling to manage this, uh, the vaccination program in the zone, and that has actually contributed massively to the loss of strength we have seen across board on, um, the euro. So I still expect, um, euro pound, um, to trade bearish for this week because it has actually gone below a local support on the daily charts. It went below local support, uh, which day was that? That was on this Wednesday, Friday, Thursday. Yeah, it went below it on Wednesday, I think, and there was a retest on Thursday. So since that retest, euro pound has been trading to the downside, and I still expect euro pound to continue to trade to the downside. I expect it to continue to trade to the downside. But let me see if I can give us some possible put. Entry point on this instrument. So currently it's looking stalled around this local support. So looking stalled around this local support at 0.84703. So since it's looking stalled around this zone, even though it's a downtrend, we should be looking out for opportunities to sell, but we don't sell at this point yet. So there's a possibility of a slight retracement from around 0.84703 So if that happens, it might retrace first to, um, this level, 0.85039, or to 0.85271. So from either of these 2 zones, euro pound will continue to trend to the downside. That's if there is a retracement from around this support. But if there is no retracement and a break below here. So once it does that, let's just wait for it to go below, close below, then retest this zone, and we have our sell trade. So one of the clear, um, instruments to trade for this week is EURGBP to the downside. Okay, so let me quickly check if there is any question so that, um, we can call it a day. Um, okay, what is the best time to start trading or enter the market considering the different time zones? some of these instruments operate. So for Mr. Anointed, the best time to start trading is when there is trade opportunities on any of these instruments. Once we are able to cite a valid trade opportunity, then we can trade. Uh, okay, okay. What other news affects the volatility on US100? Yeah, apart from maybe we have, um, the closure of the banks and maybe the stock markets in different countries around the world. So because each of these index contain more than one company, like for instance US 100 contain 100 companies, so anything that affects, any news that affects those companies, especially those ones that contributes a larger percentage to the basket, will also affect Affect the stock. So for us to be able to trade some of these stocks better than the way we are currently doing, it should be nice if we limit ourselves to maybe one or two of the index, and then we take a very close look at the constituents of the stock. So ah oh a particular let's say US thirty for example there is Apple as part of the constituent of US thirty. So you go so Apple is there. There, this one is there, this one is there, this one is there. Okay, what percentage does Apple contribute to US30? We have that. When am I expecting earnings reports from Apple, for example, or from other constituents of that particular basket that are major ones? Because there are some of those companies that might not affect movements on the index because their contribution to the basket is very small. So we will concentrate on the major contributors to those particular index. Okay, I think this would be a very good time for me to call it a day for this week's market review. We have actually taken a very long time today. Yes, we have actually taken a very, very long time. Thought it would last for 30 minutes, but we are taking about 1 hour 21 minutes. That's really, really massive. So thank you very much for everyone that was able to join up for the analysis for today. We are really, really grateful. I've seen every one of us being a part of the analysis for this week. And by next week, another round of analysis will be up for us so that we can have a very clear look at opportunities we'll be looking out for in the market. So thank you very much, everyone, and let us enjoy our holiday. Let us continue to stay safe and have a very profitable month of April. Thank you very much. Thank you.
More from Simon

How the US General Election Impacts the Forex Market: Key Trends and Trading Strategies





Hint: Average Hourly Earnings, Non-Farm Employment Change and Unemployment rate by 1:30 pm GMT