Trade Set up on EURUSD, GOLD, GBPUSD, USDCHF, DE30 for 1st-5th March 2021
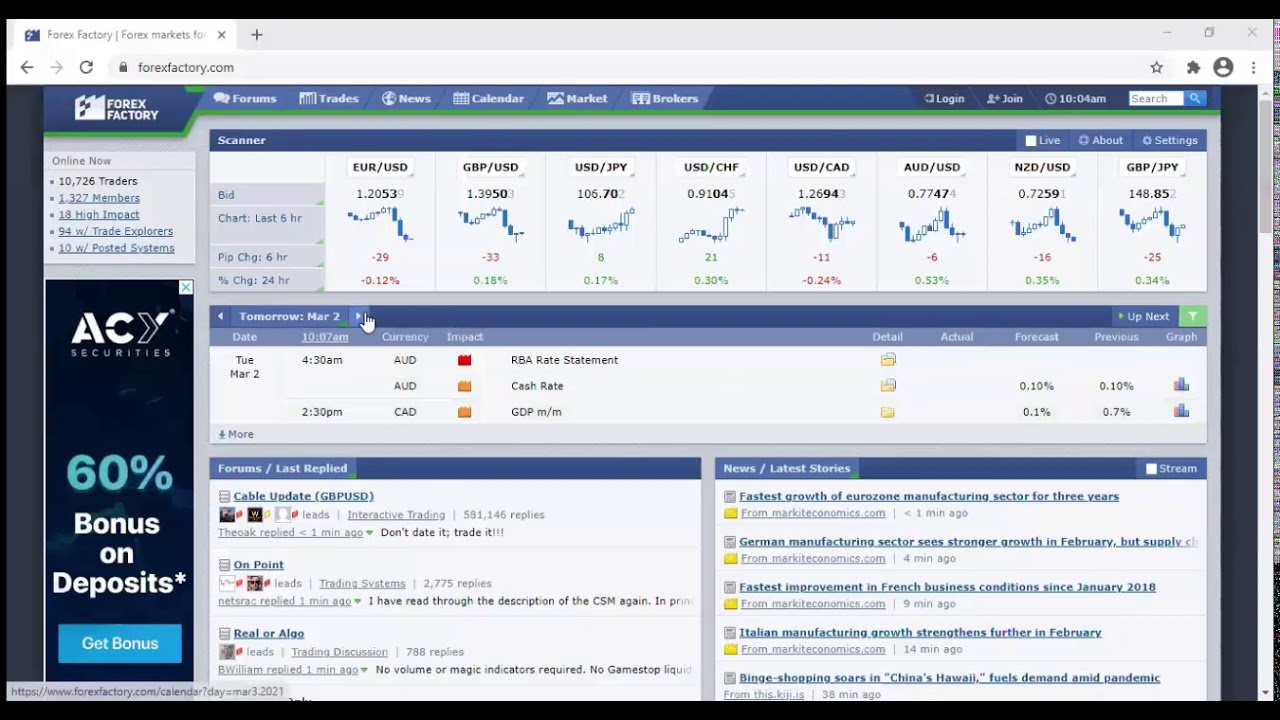
In this 30‑minute live session Simon Alagbe delivers a comprehensive weekly market review for the first week of March 2021. He begins with a macro‑economic overview, highlighting the US $1.9 trillion stimulus bill passage, the Johnson & Johnson COVID‑19 vaccine approval, and recent bond‑yield moves that have pressured equities. He then walks through the upcoming economic calendar (UK manufacturing PMI, Canada PMI, US ISM Manufacturing, ECB President Lagarde’s speech, RBA cash‑rate decision, US ADP employment, oil inventory, OPEC meeting, etc.) and explains how each data point could affect major currency pairs, commodities and indices. The bulk of the session is devoted to instrument‑specific technical analysis using daily, 4‑hour and 15‑minute charts, identifying bullish or bearish bias, entry zones, stop‑loss and take‑profit levels, and the rationale behind each trade (e.g., EUR/USD bearish on a shooting‑star formation, USD/CHF bullish on a break above resistance, GBP/USD bearish, USD/JPY bullish, USD/CAD bullish after a rejection, AUD/USD bearish, Gold bearish due to USD strength, Oil bullish pending OPEC outcome, D30 (German DAX) bullish above 14,018, US100 (Nasdaq) bullish, GBP/AUD bullish, EUR/GBP bearish, GBP/JPY bullish, etc.). He also addresses live chat questions about risk management and indicator templates. The session ends with a reminder of the next weekly review time and a motivational closing.
Chapters
Good morning, good morning everyone, and I want to use this opportunity to wish us a happy new month. This is the month where we are going to march on to glory. So if you can hear me, let me quickly get our yes in the chat box so we can start the review for the week. You can hear me? Let me get our yes, I guess, and then we can start the review for the week. Okay, so Mr. Daniel said yes, Mr. Tony Mr. Eugene, Mr. Sydney. Okay, happy new month to everyone. Okay, Mr. Kolade is also saying yes. Uh, Mr. Shafiuddin, that's fine. Um, Mr. James. Okay, this one is Chijunet. I hope I got the name correctly. So you are welcome to this week's, um, Monday Market Review. Uh, this is the first in the month of March. Happy New Month also to you, Mr. Nathaniel. Thank you very much, Mr. Ganiu. Thank you. Okay, Mr. Chile too, thank you. So they can also hear me, that's good. Okay, so before we look at, um, the major events for this week, I want us to have a rundown of, uh, major driver of, um, the markets for last week that's also expected to still continue to dominate the sentiment for this week. So over the weekend, there was some progress in the passage of the $1.9 trillion US stimulus bill as the House of Representatives in the United States finally passed the bill on Saturday. But over the course of the trading session last week, the stock market came under intense pressure as we saw sharp gains in the government's bond, which makes equities— for some of us that have been trading the equity market, we discovered that there were sharp falls in the equity markets over the course of last week. That was mainly due to the rise in the government's bond yield last week. And over the weekend too, Johnson& Johnson's Russia vaccine was able to receive the American authorization. That was on Saturday. So that optimism from the authorization of the vaccine is expected to continue to push the stock market to the upside during the course of this week. Um, so that's, uh, the major outlook, uh, for the week, especially some of the events that took place over the weekend that might still have impact in the market, uh, for today and, uh, for the course of the week if there are no other events overriding them. So at this point, I want us to move to forexfactory.com so we can check out the major events we're expecting for this week. Okay, so is it Madame Binque? Good morning, please analyze the D30 and gold. Definitely, uh, there's no way we would run a preview without checking the D30 and then, um, gold. It's definitely part of the instrument, uh, we'll be checking out on For the week. So for today, being Monday, the first day in the month of March in the year 2021, the first economic data for, or the major one, or the medium impact we're expecting for today will be released from Britain. That's the final manufacturing PMI. That's the final manufacturing PMI from Britain. Inasmuch as Britain is not a powerhouse when it comes to manufacturing, but because this data is the only one expected from Britain at this particular time, so we expect some movement based on the release of the data by 10:30 AM this morning with a forecast of 54.9. And as at the last release too, this particular data also came out at 54.9. So anything above 54.9 54.9, 55, 56. The higher above 54.9 means, um, the pound will be slightly strengthened and might see some of the pound pair pushing upward if the pound is the base currency. And by 3:30 PM, we expect the manufacturing PMI from Canada. So there's no forecast here displayed on Forex Factory, but checking the previous, we have previous of 54.4. That's the last time the manufacturing PMI was released from Canada, it came out at 54.4. So there is a slight— I feel the forecast today will still be around or will revolve around this 54.4, which was the previous, the last time around. But hopefully before 3:30 PM, Forex Factory would have been able to update the forecast so we have an idea as to what we'll be comparing the actual with. when it is finally released. And the only major economic high impact expected today is from the United States. That's the ISM Manufacturing PMI. So the forecast is exact to the previous. So any data higher than this forecast, so something in the region of 58.8 and above, would lend more strength to the greenback. And by 5:10 PM, That is when the European Central Bank President Christine Lagarde will be speaking at a virtual conference hosted by the German Association for SMEs, that are small and medium-sized businesses in the Eurozone. So being the head of the European Central Bank, we expect some volatility during the course of her speech later today, that's by 5:10 PM. So for those of us trading the common currency, that's the fiber, we have to be on the lookout for the outcome of our speech later today. So the first rate statement for this month will be released from Australia, that's by 4:30 AM tomorrow. That's when the Reserve Bank of Australia cash rate as well as the rate statements will be made available. I think I'm having a message in the chat box. Let me quickly Uh, for Mr. Franklin and Mr. Emmanuel requesting for the recording, the recording will not be made available. But if you can record yourself, yeah, you are welcome. If you can record the meeting yourself, you are very welcome. But the recordings will not be made available since it's just an analysis for the week. So the cash rate, which is expected to come out at 0.1%, just as it were the last time the cash rate information were made available by the Reserve Bank of Australia. So this time around too, we expect the cash rate to remain constant, that's at 0.10%, which means the cash rate is not going to affect the strength or the weakness of the Australian dollar tomorrow. But we need to pay more attention to the rate statement. What is Why is the Reserve Bank of Australia? Why are they keeping the rate constant? Which you are expecting. We expect them to keep the rate constant, but we need to know the reason behind them keeping rate constant. Even though we know that coronavirus has affected economies around the world negatively, and most economies are struggling to come out of the effect of coronavirus, so they need to give us some of those things they've been able to do in the last few months to be able to help the Australian economy to cope with the impact of coronavirus. So tomorrow, 4:30 a.m. more attention to the RBA rate statement much more than the cash rate, since you are expecting the cash rates to come out at 0.10%, just as it were the last time. So by 2:30 PM tomorrow, uh, it will be, uh, from Canada, um, that's the gross domestic product month by month from Canada. A growth of 0.10% is expected this time around, which is far lower than the growth recorded last time the GDP was released from Canada. It came out at 0.07%, uh, last time around, so which showed that, uh, they're expecting a decline in productive activity in Canada. So any figure above 0.1, uh, will be slightly good for the Canadian dollar, and if the data can come out above 0.7%, then it should be very, very good. So for the Canadian dollar, but slightly above 0.1% will just be slightly good for the Canadian dollar since it will still be falling short of the previous, which was at 0.7%. So on Wednesday by 1:30 AM, we expect the Gross Domestic Product quarter by quarter from Australia. So they're expecting a growth of 2.4% in the output from Australia comparing last quarter, uh, or with the same period last year, with 2.4% growth compared to a 3.3%. We all would attribute that to the effect of coronavirus on the Australian economy. So if you go above 2.4%, will be good good for the Australian dollar. But if it comes out lower than 2.4%, then we know what to do to the Australian dollar by 1:30 AM. So we're expecting, uh, the annual budget release, uh, from Britain tomorrow. So currently the time is still tentative, uh, but should be around, um, 9 AM on Wednesday. So something around 9, 10 AM on Wednesday, you should be expecting the annual budget release. So we know the budget helps to planning. So want to see the plan of the British government for the people of Britain through their budget on Wednesday. Same Wednesday, by 2:15 PM, we expect the ADP nonfarm employment change. The ADP nonfarm employment change is the precursor to the nonfarm payroll that will be released on Friday. So they're expecting a growth of that job creation to the tune of about 170,000. which is slightly lower compared to what we had, uh, the previous month. That's 174,000 jobs created, um, in the previous month. That was last month. So this time, 170,000 positive job level is expected. So any figure above 170,000, uh, will be slightly good. And if it can come out above 174,000, which was the figure we recorded last month, then it would be very good for the United States dollar. So by 4 PM, we expect the ISM Services PMI. Now, the service sector is also an important sector in the United States. So, um, the forecast this time around is exactly equal to the previous, which is 58.7. So a figure above 58.7 will be good for the United States dollar. So 4 PM Wednesday, March 3rd, ISM Service PMI will be released from the United States. And for those of us who trade oil, by 4:30 PM on, uh, same Wednesday, we expect the crude oil inventory from the United States. Even though news over the weekend has been actually good for oil, which you expect oil to continue to trade bullish for this week, but we still need to check out the inventory data from the United States on Wednesday to have an idea as to how the Texas effect, Texas events affected inventory in the United States. So a positive crude oil inventory, which means data coming out above forecast, will be bad for oil. Although there is no forecast given here at this point in time, by end of Wednesday before this data will be released, Forex Factory would have made available the forecast. So a figure that's the actual being lower than the forecast will be good for oil. So let's say, for instance, the forecast is also put at 1.3 million barrels. So if the actual comes out at 1.1 million barrels, then it's going to be good for oil. So this time around, the actual must be lower than the forecast for it to be good for oil. And for some of us who do not trade oil, you can also trade this crude oil inventory indirectly by trading some currencies that are oil-dependent currencies such as the Canadian dollar and Norwegian krone. So you can decide to trade any of those 2 currencies at 4:30 PM when crude oil inventory will be released. So by 5 PM same day on Wednesday, uh, a member of the Monetary Policy Committee of the Bank of England will also be speaking. We know the importance of, um, you Bank of England, and this is a key member to be having a speech by 5 PM. So we need to be on the lookout for that speech to have an idea as to the plans of the Bank of England with respect to rates and then their support system for British citizens. So by 9:15 PM, the Reserve Bank of New Zealand Governor, that's Governor Orr, will be speaking. So as the head of the Central Bank of New Zealand, known as the Reserve Bank of New Zealand, his speech will lead to a lot of volatility in the market. So for some of us that trade the Kiwi, we need to pay attention to whatever the governor will be speaking. Even if you're not going to trade the speech directly by 9:15 on Wednesday, an idea as to the plan of the Reserve Bank of New Zealand to stimulate the New Zealand economy will help us In the direction of our trade for the course of the week, that's on Thursday and on Friday after the governor has been able to deliver his speech. So Thursday, we expect the Joint Ministerial Monitoring Committee of OPEC to have a meeting. So it's going to be an all-day event, but at the meeting we're expecting OPEC to make a decision on production quota that will likely take effect from the month of April. So they are starting this, uh, meeting on the 4th of March to give us an idea as to the production quota we'll be expecting from the month of April. Will OPEC decide to increase our supply quota come Thursday. So let's just keep our fingers crossed and wait until Thursday for idea as to the plan of OPEC, uh, with respect to oil. And oil has actually been on a very good run recently, so that might actually encourage them to increase supply quota coming from the month of April, which is next month. So oil traders, it's an all-day event. On Thursday, so the outcome of the meeting should be out later in the day on Thursday, and the outcome is going to dominate sentiment come Friday for those of us that trade oil. And as I mentioned earlier, when we're checking crude oil inventory, so even if you are not trading oil directly, if you trade petro petrocurrencies such as the Canadian dollar and the Norwegian kron, so you can also use this information to know if. Canadian dollar is going to be strengthened or the Norwegian krone is going to be strengthened or not. So same day, Thursday, 6:05 PM, the head of the Federal Reserve in the person of Jerome Powell will be speaking. So as the head of the central bank, that's the largest central bank in the world, so we expect a lot of volatility on the dollar pair when when he's speaking, not just volatility on the dollar pair at that time. So it's also going to give us an insight as to what we're expecting, um, on the greenback, uh, for that time and then later in the day. That's on Friday, um, to follow that particular day. So Friday will be the day we have all been waiting for, a very important day when it comes to job data from the United States. So by 2:30 PM on Friday, we are expecting first the average hourly earnings month by month, the nonfarm employment change, formerly called nonfarm payroll, and the unemployment rate. So these 3 key job data will be released at the same time, that's by 2:30 PM. So if you have never traded fundamental events in the past, this will be a very good time for us to start. Friday, 2:30 PM. So average hourly earnings, we are expecting how much labor earns on average to have grown by 0.2%, same as what it were, uh, what it was the last time this data was released, as same as 0.2%. So a growth above 0.2% would be good for the United States dollar. And we're expecting jobs to be— jobs outside of the farming industry to have grown by 133,000. which is far above what we had, uh, the last time, which was just 49,000. So a figure above 133,000 will be very good for the United States dollar. And for unemployment rates, we— the forecast is showing a slight increase in unemployment rates. A slight increase in unemployment rate is expected, uh, based on this forecast. But if The actual can come out as the previous, then it's going to be good for the United States dollar, especially if nonfarm employment change and average hourly earnings has actually come out, uh, good for the United States. So if all the 3 data come out good for the United States dollar, then it's going to be a very massive buy for those of us that will be trading the greenback come Friday by 2:30 PM. And then we round off the week on the fundamental front with the news from Canada. That's IVPMI, Purchasing Managers Index. So the PMI is expected to come out at 49.2. So if you go above 49.2, uh, is going to be good, uh, for the Canadian dollar, especially because the forecast is even above, um, the previous for this week. Okay, so do we have any question at this point before we go to the charts? Uh, to also look at the technical setup on some of the instruments, uh, that we trade. And one good thing about this week's analysis is that if there are trade opportunities, you are going to also share with us that, okay, this particular instrument, if you can trade them at this point in time. Um, okay, so Mr. Anointed is saying, what do you mean by will be very good? And when it is good for a particular currency, it means you buy the currency because the currency is expected to appreciate in value. As at the time the data is released. No, this is fundamental event. So it is just to if affect the market or affect the instrument as at the time the data will be released. Okay, please what you just said about repeat what you just said about the greenback. The greenback is the dollar. So what I just said is if these three data from the United States on Friday by 2:30 PM, if the 3 comes out good, and specifically if unemployment rate can be around 6.3%, which was just equal to previous which we had last month and lower than forecast this time around, then we should expect some massive buys on the United States dollar because the greenback is going to be strengthened with, uh, the release of that data. Okay, so thank you. Madame Queenette. Okay, so now we look at the charts to have an idea as to what we're expecting some major currency pair, some commodities, and some index to do during the course of this week. So I'll be starting the analysis with EUR/USD. So this is the chart of EUR/USD on the daily chart. So looking at this particular currency, we see it swing high and then got here, and from this level was rejected before trying to push up, got rejected again. And, uh, from the candle we had, uh, which day was this? Um, this was on the 25th. 25th should be like, uh, which day is that? That should be Thursday. So on Thursday we have a formation that looks like, um, a shooting star. With this candle confirming that it's looking as if this pair is going to the downside. So for EUR/USD for this week, from what you can see on this chart, it's looking as if EUR/USD would be bearish for this week. This formation actually supports a bearish formation on EUR/USD for this week. But let me just check if there is any trade opportunity right away that we can take advantage of on EUR/USD, because we should be looking out for opportunities to sell EUR/USD for this week. Uh, so currently EUR/USD is trading very close to, um, this local support, uh, so it's just, um, some few pips away at 1.20243. So for some of us that are not yet on the trade, uh, let us just wait for this instrument to go below 1.20243, then we can also have our own sell trade. Because from here, uh, the previous time this instrument goes around this price level, we saw what happened. So in as much as it has not traded below, uh, 1.20243 for some of us that are not yet on the trade, we have to wait for us to initiate a sell trade on EUR/USD. So let me also check with one of the templates we are using at this time for our training. Okay, so on the 4 hours, uh, so this is already showing to us that EUR/USD should be going down, and currently it's doing that. And from previous, um, levels we checked We are expecting EUR/USD to continue to trade lower. But on 15 minutes at this point in time, it has just given us a sign to sell. So anyone who wants to sell right away, even though I've given us a level that we need to wait for, we need to have our stop loss above here. So a stop loss at around 1.21088. Even if you are selling right away, you should have your stop loss at 1.21088. So you place a sell now. Um, then you have your stop loss around this price level. So you have your stop loss here for EUR/USD. But the best bet is for us to wait for it to go below the support level, um, I told us, um, the other time. So this support here, let's just wait for it to go below that support. Let's just wait for it to go below 1.20212. But for some of us that might want to take the trade right away, you can take the trade right away but have our stop loss at 1.21076. That's very important. So EUR/USD for this week, I will expect a bearish EUR/USD for this week. Okay, so Mr. Olushola Ojekunle is asking that what if the unemployment rate gets higher, can that override the dollar value? Uh, if unemployment rates, um, comes out slightly higher, uh, that's going to weigh on the strength that the greenback ought to have compared to when the 3 data comes out very good for the dollar. So that's— that means the kind of move we would have witnessed on the USD pair would not be as strong as what we are going to see based on unemployment rates coming higher than what was envisaged as the forecast. So Mr. Oyemachi is asking, some has no data, how do we know the outcome? Well, because it is not yet time for the data to be released, the forecast, uh, the actual at this time will still be blank. Until the time that is specified on the site. If it is 2 PM on Wednesday, until 2 PM on Wednesday, forecast will still be blank. So we need to wait until that time for us to know if it is good for the currency, then we're expected to place a buy trade, or if it is bad for the currency, then we're expected to have a sell trade on that currency. So for some of us that might, uh, that will be taking this EUR/USD trade, I have not given us the first level TP. So let's just wait for it to go below 1.20196 and have our first take profit around this local support at 1.19548. So once it trades below 1.20196, thereabouts, uh, 179 thereabouts, We have our take profits at 1.19565. That's the first level take profit on EUR/USD for this week. Overall, let us be looking out for sell opportunities on EUR/USD for this week. So the next instrument to be checking now is USD/CHF. So on USD/CHF, we see USD/CHF Um, with this formation around this local support, then it was confirmed. And from there, we have seen USD/CHF on the daily chart pushing higher. So USD/CHF is also trading very close to another local resistance that's around this price. But if we check from here to where USD/CHF is currently trading, um, it is giving us some opportunity to still make some money before it gets to this particular resistance in view. Uh, so moving to the 4-hour time frame, um, let me check. Yeah, so it has just been able to— this current candle on the 4-hour has been able to go above, um, the resistance. So if this current candle on the 4-hour time frame is able to close above, uh, 0.90997, so USD/CHF is going to be a very good buy for the course of this week. So this week, let's be looking out for opportunities to buy USD/CHF. Let me check with the hybrid candlestick formation. Yeah, so here too we can see that we have gotten the signal as of 17th of February to continue to buy USD/CHF. I'm looking at it on 15 minutes, um, at this point in time. Yeah, so we got a signal to buy around this level. Um, so if one had actually placed the buy, then, uh, one should have Um, exited the position as at around this level, that's 0.91005. And because we've not had the trade as at that time, so if you are just joining now, we should have our first take profits. Um, let me change this and get a better level for us. Um, Yeah, so we can have our TP for this week at around 0.91585. So a buy on USD/CHF is expected because I'm expecting the greenback, that's the United States dollar, uh, to be strengthened for this week. So a buy trade is good with a take profit at 0.91 5, 8, 6. Uh, so for some of us that have taken the trade, let us have a stop loss around this price level, that's 0.90597. A stop loss at 0.90597. So USD/CHF, we buy for this week. So buying opportunity is what we'll be looking out for on USD/CHF. So this is Great Britain pound against the United States dollar on the weekly chart. So looking at this instrument, we see that this instrument is getting rejected around this resistance on the weekly chart, so giving us information that looks like the shooting star. So this is creating an opportunity for us to be looking out for sell opportunities on Great Britain pound USD for this week. But moving to lower time frames here on D1, so we can see that, yeah, something like a shooting Star, which has actually been confirmed on the dailies. So US GBP USD also for this week is a sell trade. So a sell on GU is also expected. Uh, so if you have a sell now, but let me give us a very good entry level and a stop loss for our GU trade. Okay, um, 4 hours, let me add, um, the hybrid. Okay, so we have just gotten the signal to sell GU. On the four hours time frame, which is great. So let's move to fifteen minutes for a good entry point for Great Britain pound USD. Yeah, we have just got you one. So if you if you have a sell now, so sell G, then we have our stop loss above this local resistance that's around 1.40070. That's where we have our stop loss. For some of us that might have taken zero USD trade, I'm already in some small profits now. So it's currently at ₦65, so it's small because I'm using a small lot. That's why the profit is a bit small. So EUR/USD this week, sell. GBP/USD for this week, let us be looking out for sell opportunity. So we have our stop loss at this price level. So, uh, our take profit, first level, let me give us, um, first level take profits. Okay, so first level take profit is a bit close. Uh, this level, that's, um, 1.38878. 1.38878, that would be our first level take profit on GBP/USD for those of us that have entered the trade now. Uh, but for some of us that might want to wait, you don't want to make small money on the trade, let us just wait for it to go below 1.38878. And then we target overall for this week, first level, this support at 1.38381. And if it's able to go below this level, then we can also target 1.3337791. But first level, let's target 1.38250. And for those of us that have entered the trade right away, we have our TP at 1.38878 with our stop loss At this level, let me get the stop loss value price level. That's at 1.4067, 1.40067. That's where we have our stop loss. I think I'm having some questions on the chat box. Let me quickly check the questions. You will need to listen to the speech to find out, or you can check it. Okay, okay, okay. Mr. Iman is saying no audio. Okay, so if you are not Uh, let's check your audio settings. Okay, so GU sell, uh, if you can sell now, it's fine with our TP at 1.38878 and our stop loss at 1.40073. Once it goes below that level, we target 1.38250 as our second level take profit on Great Britain pound against USD for this week. So USD/JPY, USD/JPY on the daily charts is trading very close to a local resistance, as you can see here, trading close to this resistance. But if you look at Where it's currently trading to where that resistance is, is still— this still gives us the opportunity to still get some pips before it gets to that resistance. So moving to the 4-hour timeframe, adding this template hybrid, yeah, we have gotten a buy opportunity signal on USD/JPY on the 4-hour timeframe. So if I move to 15 minutes, do I have a recent signal for a buy? Yes, we got a recent signal of for USD/JPY. So if I take a buy now, um, okay, I've not closed this. I take a buy now for USD/JPY. Buy. Yes, I have my stop loss on USD/JPY for this particular trade at around this price level. That's 106 points. What's the price level? 106.356. 106.356 as my stop loss. On this trade on USD/JPY, and for our take profits for this week, okay. So for our take profits for this week, so let's look at. 107.235. But buy trade, um, is the best trade for us to be on for USD/JPY, uh, for this week. Buy opportunities on USD/JPY for this week. And for those of us that might have entered the trade, let's put our stop loss at 106.356. 106.356 for USD/JPY. 106.356. Okay, okay, okay. So Mr. Yamachi is requesting for, um, the hybrid indicator. Okay, so you can actually speak with your account manager so that you can also have access to, um, the new strategy that we are giving out to our clients at this time. But in as much as you're able to follow up with what we are sharing with ourselves here, uh, you'll be able to have some very profitable trades, um, this week. So let's continue. We move to USD/CAD. Uh, so for USD/CAD Yeah, so USD/CAD on the weekly chart got rejected around a support region that was last week's candle. So we would be expecting this week candle to be able to confirm this rejection we have seen on the weekly chart on this instrument despite the recent surge. This Our bearish move we have witnessed on USD/CAD is basically due to recent surge in price of oil. So oil has actually supported the Canadian dollar and has led to a massive crash in USD/CAD for a couple of weeks now. Since around the 8th of March, you've seen this last year. Yes, 8th of March, USD/CAD has actually been on a bearish trend, has been coming lower and coming lower. But for this week, I'm expecting USD/CAD to recover some of the lost ground, especially if you check this 4-hour timeframe. We can see this massive candle confirming the rejection around this support level, which I pointed out to us on the weekly chart. So on the weekly chart, I showed us this support region that USD/CAD got rejected on around this support on the weekly chart. So moving on 4 hours, you see the same zone Here, then from there we we saw this massive bullish candle showing to us that the buyers are still very much in this market. So it's still a buyer's market. USD CAD for now is still a buyer's market. Um, so adding hybrid indicators. Okay, so you can see here the last signal we got is still a buy opportunity. So let me move to 15 minutes if there's a recent buy signal on 15 minutes that we can use to initiate a trade. Oh, not yet. On USD/CAD. So for some of us that already have this template, what we just need to do is wait for this old sell signal to be out of the market, and then we get a buy signal arrow in the market. Then we should have our stop loss below the arrow. A stop loss below the arrow. Once you use it to place your trade, you have your stop loss below the arrow. So stay on USD/CAD 15 minutes, wait for the bullish arrow to tell you to buy. Then have your stop loss below the arrow, below the low that you can see on the chart. As at that time, I thought that there's going to be a setup for us to place a trade right away, but there's none. But despite that, let's wait for it to give us a buy signal, 15 minutes, then we buy with our stop loss below the arrow. So looking at this particular one, for example, this is a buy signal though in the past. I want to just show us how to have our stop loss, and then there is a low not too far away from that arrow. So if you want to have your stop loss, you have your stop loss below the arrow, below the low. Yeah, so if I drag this slightly up now, so I have my stop loss around this level, below the arrow, then below the low. So it cannot— it might not be as far as that. Yeah, so somewhere around this region, fine for my stop loss. So stop loss around there will be fine based on this arrow. So if you also receive another arrow, so you get a low Just like I got this low for my stop loss on the 15-minute time frame to have our trade. Okay, so I'm having a couple of questions here. Uh, okay, so Madame Queenette, yeah, we will get to gold. I think gold is among the charts I have opened. I will get to gold because the template works on all instruments. Uh, okay, Mr. Inamdi, what was my entry point for USD/JPY? I've already told us USD/JPY, we should be looking out for opportunities to buy. So you can buy now but have your stop loss Loss at 106.356. Have your stop loss at 106.356. That's all. For AUD/USD on the daily charts, uh, this is a rejection from around a resistance. So we saw this rejection, then this candle confirmed rejection on the daily charts. So which is giving us an insight that we should be looking out for sell opportunity on AUD/USD for this week. So moving to the 4-hour timeframe, yeah, so we can still see that this was the zone where we got the rejection. Let me add a thought to it. Okay, so we just got a signal to sell. The only challenge with this one, okay, yeah, so a signal to sell AUD/USD, uh, we have it here. So moving to 15 minutes at this time. Yeah, so it's even telling me now we got the alert too. EMH cross trend going down AUD/USD. So we sell AUD/USD, then we have our stop loss above the arrow. So we sell now, then we have our stop loss above the arrow. Stop loss above the arrow. So once I drag my stop loss now, give us the price so we can also have zone as our stop loss. So a stop loss on AUD/USD at 0.77796, 0.77796 as our stop loss, uh, will be a fine zone to have a stop loss on this instrument. So AUD/USD for this week, I will be looking out for opportunities to sell because we're expecting the US dollar to be strong, uh, for this week. Now for the index, uh, based on the information I read to Ross as at the inception of this week's analysis, from the Johnson& Johnson approval over the weekend to the progress recorded in the $1.9 trillion US stimulus package by the House of Representatives, all attention will now shift to the Senate as they deliberate on the same bill. Hopefully the Senate is also going to pass that, but I'm not expecting it to just be a smooth sail, uh, because of the formation of the current Senate in the United States. Hopefully, uh, it's going to come out good, and that should push, um, the stock market, uh, further to the upside. So looking at, um, these instruments on the 4-hour time frame, um, so there is this zone. So price got around this zone, and then from there We have seen some tiny retracements around that particular zone. So let me move to the hybrid indicator and see if I've got a buy opportunity. Not yet. On the 4 hours, this is still showing me to have a sell trade on US30. But for me, I should be looking out for opportunities to buy US30, which means for this particular instrument, we are not going to follow this signal. We have just received. So let me check out support and resistance. Okay, so so here this instrument has actually traded flat around this zone. So we have seen some flat trading on US thirty around this zone for a couple of. Days before we had a surge to the upside, and then it came back to within that channel where US30 was trading on the 4-hour time frame. So at this point, it's also about to re-enter that particular channel. So this current candle on the 4-hour time frame is trying to push inside the same channel where it traded for a couple of days as at the time it was in there. So there is a possibility of this candle being able to close inside again and then trade similarly the same way we did for a couple of days at this point. So you can see it there trading within this bound, that's 316647, 31647, and 31224. So once it's able to go above 31224, we can have a buy trade and then have our TP at 31647. But for this instrument, let us be looking out for opportunities to buy. For this week, opportunities to buy owing to the fact that there were a lot of positive optimism from the weekend that should drive the stock markets to the upside, barring any. So TP for AUDUSD. Okay, I didn't give us TP for AUDUSD. Let me quickly return to AUDUSD on our time frame. Let me change this to I can do stick. Uh, so for AUD/USD, our first TP will be around this local support here. That's 0.76937. Uh, that's where we have our first take profit level. Then after that level, we also look at— but for the current trade, you should have your TP at 0.76937. Then the second level for our TP for this week will be 0.76512. But AUD/USD, let us look for Opportunities to sell. Then US thirty have told us, let's wait for it to go above 31224. Then we buy with our TP at 31647. So once we get to 31647, there is a possibility of a repeat of what happened here happening once again around this channel on this instrument. So wait to go above 31224. Then you buy to close your trade at 31647. Okay, so for D30 on the day chart, we saw this jump, uh, to the upside this morning. That's as a result of the optimism over the weekend, uh, which is expected to continue to drive, uh, the stock to the upside. Uh, but checking on the 4-hour time frame and adding Uh, these are templates to it. That's the high break. Uh, let's see if there is a buy signal. Okay, at this point we are still waiting for us to receive a buy signal on the U30. So let's just wait, um, to get the signal to buy the U30 on the 4-hour time frame, then we start to buy. So once you get the signal to buy, um, then you move to 15 minutes and you start buying once you get an arrow that says buy. Like if For instance, currently we had a buy signal on this instrument, but currently what we had there was a sell. So if it were to be a buy signal, we could have bought now and then have our stop loss below this low. We have a stop loss below this low, and then we are going to be fine once we have the buy signal. But currently we don't have the buy signal yet, so which means according to this signal, uh, according to this strategy, we wait for us to receive the buy signal. Then we come to 15 minutes and start buying once they— we get the signal to buy, signals to buy, signals to buy, and buy, um, alone. So because there's no signal on this, let me check, um, support and resistance and see if there's any opportunity created, uh, by the support and resistance. I'm moving to, um, the 1-hour time frame. Uh, well, currently based on the position of this instrument. This is a rejection from around this resistance on this instrument, which is not looking so good for us to have a buy trade yet, even though the optimism still favors the upside much more than the downside. So it's better we still wait and see how this current candle ends, um, on the 1-hour time frame. But it will be great if we can wait for this instrument to go above this verified resistance, as we can see here. verified resistance is at 14,018. So D30 will be good for a buy once it trades above 14,018. So if you buy above 14,018, you ensure you close before the next resistance, which is at around 14,054. Though that's a short target level for that particular trade, but it's great if you can actually makes that particular opportunity of, um, G30 from around that zone. But currently it's not giving us any direct opportunity, um, to either buy or sell yet. Um, okay, so currently supported by the moving average. Well, let's just wait and let it trade around those price levels. That are given to us before we enter a buy or a sell trade on the instrument. Okay, okay, GBP/AUD from Mr. Ekwuenyong. Okay, if time permits, we might be able to also check on GBP/AUD. From Mr. Franklin, I think I've given us the stop loss for AUD/USD. I think I have done that so far. But for GBP/AUD, well, if time permits, we might be able to also check Keep it here, Udi, because we only have 10 minutes left. Although we also have even ended the meeting by now because it's scheduled for just 30 minutes, but we still need to cover the instrument I have opened currently. Okay, Madam Angela says gold. Yeah, hopefully we'll be able to also check on gold as we move on. Yes, gold is the next instrument. Okay, so just as if the instrument was listening to Madam Angela and requested for gold. Okay, you did not get the stop loss for AUD/USD. Let me check my trade. Okay, I have the stop loss here at 0.77796. 0.77796, that's where I have my stop loss on AUD/USD. Okay, so for gold, with the expected strength in the dollar, so we expect gold to, to trade bearish, not just due to the strength in the dollar, also due to some positive news with respect to the vaccine, especially the approval of the Johnson& Johnson one-shot vaccine over the weekend, and then also the passage of the $1.9 trillion US dollar stimulus package. By the House of Representatives also over the weekend. So that optimism means we should be looking out for opportunities to sell gold for this week. And from what we can see here, this is giving us a signal that it's looking good for us to have a sell trade on gold. Let me move to 15 minutes on gold and see if the current signal is a sell. No, currently this is a signal to buy, and this program is already thinning out, which means very soon, very, very soon, we are going to receive a signal to sell gold. And immediately that comes up, then we should have a sell trade with our stop loss above the arrow. The stop loss we have on gold should be above the arrow. So for gold, for this week, we'll be looking out for opportunity to sell gold, uh, for this week. Okay, so US100 is just like, um, the other instruments we've checked, especially the index where we're expecting, um, some bullish move for this week. So for US100 too, uh, we'll be looking out for opportunities to buy it for this week. Okay, it's currently trading below the 21 EMA though, but, um, Looking out for opportunities to buy gold. But let me, let me just get some levels where it should be safe for us to have a buy. Currently it's trading above this support region on the daily charts. Um, yeah, same here too on the 4-hour time frame. So it got rejected last time it got to this verified support. And yet, even though this seems as if It broke to the downside, but it was a false breakout as this candle came back above that support, which means this support still continued to hold forth. Then there was a rejection, and since then US100 has been moving to the upside since this rejection, since it got rejected around this support. So for US100, if you buy now, you should have your first TP before this next weak resistance. Even though it's a weak resistance But it's going to be safe for us to close our trade before it gets there. That's around 13322.20. 13322.20. Okay, I'm having a couple of questions. Yes, okay, so thank you for helping out. Okay, okay. Okay, so I think I've answered every question currently here. And Mr. Ashikun, thank you very much for the link that you've been able to drop. So for some of us that are requesting for the templates, you can just visit that, um, address here. That's tinyurl.com/rallycftp. All the indicators we give out to our clients are there. So you can, if you are, if, if you have, if there is any question how to install, you can reach out to your account manager or you can send a question to feedback@rally.academy, feedback@rally.academy, and someone will be right there to guide us on how to install and how to use the indicators. So thank you, thank you, Mr. Shigon, for the answer. Okay, so for oil, uh, for this week, so, um, all eyes will be on the expected meeting, um, of OPEC, uh, that's on Thursday, and, um, the crude oil inventory. So that's going to be a major driver for the direction of oil. You know, oil, even though technicals sometimes do influence movement on oil, but most of the time It is fundamentals that directs this commodity more often than technicals, but we still need to do justice to it technically. We check the instrument technically, but we need to focus more on the major drivers, which is the fundamental for this instrument. Yeah, so there was a gap to the upside on oil. on opening for this week, which was due to the optimism around the world, the new Johnson& Johnson vaccine helping and then pushing up optimism that economies will open faster than envisaged earlier. So that's, that's actually a very good one for oil. So which means we should be looking out for opportunities to buy oil for this week. But currently we can see that oil is trading narrowly Uh, this is on the 1-hour time frame. So you see oil trading within this very narrow band. Uh, yes, just trading within this narrow band. That's between 65.71 and 65.29. So it should be good if we can wait for oil to trade outside of these 2 zones. First above 65.71 for a buy, but if below 65.29, then can be looking out for sell opportunities. But I don't want us to sell oil for this week except the OPEC DMMC meeting this Thursday doesn't come out good. That's the only time it would be safe for us to sell oil. So we should be looking out for opportunities to buy, which means let us wait for oil to climb above 65.71, then we can buy oil with our targets at 66.70. That's the first TP target. Then you can look at 68 as 67.55 as our overall target for this week. Overall target for this week. So I'm expecting oil to trade as high as $67 this week in as much as OPEC MLC meeting goes on as planned and ends favorably on Wednesday. Okay, for euro pound, and someone requested for GBP/AUD. I hope I will be able to look at it because I only have three minutes left. Okay, let me see if I will be able to also check out euro. Oh no, GBP/AUD has requested. So currently here too, on euro pound on the daily chart, this is a rejection here. On, um, euro pound. And the next candle, which was— that was 3 days ago, that will be on Thursday. Yes, on Thursday, likely on Thursday, actually confirmed that, um, this instrument should have some bullish move. That's what this particular candle told us. But from the one we had on Friday, this one also contravened, um, the signal we got. On the instrument that was that will be on Friday. Yes, that was on Friday. This now shows us that there's another rejection from around this level. So we got this instrument got rejected at 0.85437 and got rejected again at 0.87280. This is giving us a clue that for now this instrument wants to trade just within these zones. 0.87280 and 0.85437. That's the zone where euro pound is going to trade for this week. That's what, um, this rejection we are seeing on this chart is telling us. So it means for now, for today especially, uh, we should be looking out for opportunities to sell to around 0.85437, opportunity to sell to around that price level. Um, on euro pound. Yeah, opportunities to sell euro pound to around 0.85437. So you can see the same thing on the hourly time frame. But for those of us that do not have an active trade on this instrument yet, uh, let us wait for it to go below around the support where it is trading now. That's 0.86267. So once it trades below 0.862 67, we can have a sell trade with our first TP target at 0.85955. So we sell euro pound once it goes below 0.86267 with our TP at 0.85955. 0.89555, that's the first TP. And then eventually for the, for the week, we should be looking at 0.854 Okay, so I think I'm having some questions in the chat. Sir, SL for oil. Okay, I did give us stop loss for oil. Okay, let me quickly get back to check oil. Uh, so for oil, in as much as we are looking out for oil to trade above 65.71 before we have, uh, the buy trade, so we can have our stop loss around this, this zone. First here, 64.92, but it would be nice if you can have a stop loss below this low, that's 64.09. But for some of us that might not want to consider a stop loss as wide as this, can have a stop loss around this first low here, that's 64.91. That's— you buy when it is above 65.71. Okay, so euro pound, I think I've attended to that. So we move to, um, Great Britain pound against, um, Japanese yen, that's JPY. Okay, so this got to around this resistance, and from this resistance, similar to what we had on, I think, euro pound, yeah, then got rejected from the downside around the local supports around this level. So from 150.342 to 147.466, that's where we are expecting JPY to trade for the course of this week. So once it comes back to test 147,466, then we can have a buy trade with our target at 150,342 for this week. 150,342, um, for this week on GJ. So a buy trade would be the best bet, but there is a possibility of a retracement from around this zone to 147,466. Before it trades to as high as 150342 for this week. So EJ, um, sell opportunity for this week. Um, well, before we look out for those price levels, let me see. Yeah, so this is able to trade below this local support. Okay, I think there's still some rejection around there. So there was a rejection, um, around this local support the last time this instrument tested this local support, there was a massive surge to the upside, which is also giving us an idea that this instrument is going to do the same thing, especially owing to the fact that there was a rejection around this level, uh, the last time we got there. So we can have a buy trade right away. Yeah, and we're going to have a very tight stop loss. That's the good thing. So buy now, then we have our stop loss just below this local support. Pretty good, pretty good stop loss level, pretty good. This is a very good entry, uh, for this trade. So for the first take profit level, we can target this level that's 128.831, 128.831 as our first take profit level. This resistance as our second take profit level. And eventually, if it's able to break above here for this week, we might be looking at This level for Euro JPY. But for now, let's have the buy trade with a take profit at 128,796 thereabouts on this instrument. Simon said, "I didn't give stop loss and TP for both." That's is that possible? For gold, I told us to wait. Or did I tell us to have a trade yet? Because currently this is showing to us that there is a possibility of we receiving a signal to sell since we will only sell gold for now. So since we only sell gold for now, so we just need to wait for that arrow that says sell gold. Then we have our stop loss above the high, above the arrow. So either if the arrow is the highest recent high, so we have The stop loss above that arrow. But if there is another high above that arrow, so we have the stop loss around the nearest high to where we receive the arrow. So we wait for gold for now until we get the signal to sell it. So sell opportunities on gold for this week owing to optimism around the world. Okay, so and this will be the final instrument. For this week, sorry, very sorry for the break in transmission. It was due to. Some internet issue at this end. So this is the final instrument for this week for the person that made a request for it. That's Great Britain pound against the Australian dollar. Although I don't really trade this pair, but because of the request, that is why I'm actually looking at it. I don't trade it. So here we see this instrument from around these supports. Then this particular candle was able to break outside of this local resistance. So with this, we got a retest, which is what, um, today's candle is doing— retesting to confirm that what used to be a resistance that has now turned to a support is a very strong zone. So from here, we can have a buy trade on Great Britain pound against the Australian dollar. But let me move to our time frame to get good entry points on this instrument. But we'll be looking out for opportunities to buy this instrument. Um, so 4 hours, yes, there is a massive rejection here too, just as we were able to see on, um, the daily chart. So from here we can buy with our TP first around this resistance, that's 1.80929, 1.80929. That's why we have our TP overall for this week. And one good thing about having our trade now, a buy trade on this instrument at this point, is that Our stop loss will be as tight as possible, just around this level. 1.79737 will be fine for our stop loss, just below the support with our TP. So if you look at your risk reward, it's worth it. Your, your reward is around 1.8099 with a risk of 1.79737, which is very, very okay for this particular setup on this instrument. So I think this would be a very convenient point to call it a day. Um, yes, this would be a very convenient point to call it a day for, uh, this week's, um, review. I look forward to having us join us once again, same time next week. Uh, that's by 10 in the morning. So thank you very much everyone for being a part of today's analysis. I pray we have a very wonderful week and a wonderful month of March. Thank you, stay safe, and enjoy your week. Bye then.
More from Simon

How the US General Election Impacts the Forex Market: Key Trends and Trading Strategies





Hint: Average Hourly Earnings, Non-Farm Employment Change and Unemployment rate by 1:30 pm GMT