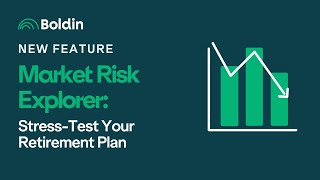
Patrick Hammons walks through Bolden's new Market Risk Explorer, which simulates downturns to show how market crashes affect your retirement plan. Run a preset scenario like three years of -15% returns or a decade at 1% growth, and watch your success odds shift instantly: an 80% chance drops to 30% in a severe crash, or 50% in a prolonged slump.
Chapters
Hi, my name is Patrick Hammons, a product manager here at Bolden. I'm excited to share a new addition to the Bolden Planner called the Market Risk Explorer. It's designed to help answer one of the most important questions every financial planner eventually faces. How can you be sure your plan will hold up if the market takes a turn for the worse? You've put in the effort to build your plan. You've made decisions about saving, investing, and when to retire. All that work is about one thing. Living the life you want in the future. But markets don't always cooperate. Downturns are a normal part of investing. The challenge is figuring out how much they might affect your plan, especially if they happen early in retirement when withdrawals make you more vulnerable. That's why we created the Market Risk Explorer. It's a capability in the Bolden Planner that helps you simulate downturns and see their effect on your chance of success score and your projected savings. Chance of success is one of the most important numbers in the planner. It represents the likelihood your plan still has money at your longevity age. In other words, that you won't run out of money before the end of your plan. The Explorer makes it easy to test how different kinds of downturns could shift that number. So instead of worrying about what if, you can see in seconds whether your plan is resilient enough. The benefit is simple peace of mind and the confidence to know you're not just planning for the good years, but for the challenging ones as well. Now let's take a closer look at how it works inside the Bolden Planner. To open the Market Risk Explorer, go to the Explorer section in the left menu and select Market Risk Explorer. The first choice you'll need to make is which accounts to include. This matters because not all accounts react to downturns the same way. By default, short term accounts like checking and savings are turned off since they don't move with the market the way investments do. This keeps the focus on the accounts that are most at risk. Next, let's look at the types of downtrends you can test. This is where you start to see how resilient your plan really is. There are two preset patterns, plus the ability to create your own. The first is a decade of poor returns. This simulates 10 years of weak market performance with modest annual returns of about 1%. As you'll see on the chart, your new projected savings with market risk bends lower for a longer stretch, showing how slow growth can steadily erode savings. The second is a three year sequence of bad returns. This simulates three consecutive years of negative returns starting around minus 15%. Notice how the line drops sharply at the beginning of retirement. That's the sequence of returns. Risk in action the timing of those losses matters more than the size of them. And the third option is create a downturn. This gives you flexibility. You choose the year the downturn begins, set how long it lasts, and decide how deep the losses go. It's a way to model the scenarios that matter most to you, whether that's a sharp crash, A slow decline, Or something in between. Once you make a selection, the results update instantly. The My Savings projection chart shows how your portfolio shifts under pressure. And most importantly, you'll see the change in your chance of success score. This is where the Market Risk Explorer delivers its real value. It's not just about looking at losses on a chart. It connects downturns directly to the number you already know and use. So if your score Normally sits at 80% and a three year crash brings it down to 30%, you can see immediately how exposed your plan would be. Or if a decade of poor returns nudges it down from 80% to 50%, you can see that while less dramatic, it's still a risk that deserves attention. The Explorer doesn't tell you what to do next, but it makes the risk visible. From there, you can decide whether to model changes, your plan with a scenario, or to book a call to talk it through with one of our amazing coaches. The big picture is financial planning isn't just about charts and numbers. It's about building the life you want and staying flexible enough to adapt when things change. That's exactly what the Market Risk Explorer is designed to help with. So I encourage you to log in, try it out, and take the guesswork out of determining how a crash might affect your future. If you found this helpful, be sure to subscribe to Bolton's YouTube channel for more financial planning tools and tips. Thanks for watching and I'll see you next time.