Excel Hour - Learn to Excel with the FP&A Guy
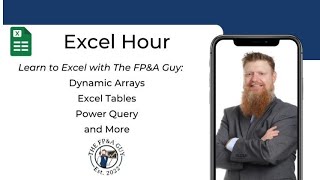
This is a YouTube video titled "Excel Hour - Learn to Excel with the FP&A Guy" created on September 18, 2024. It features podcast content focused on financial planning and analysis (FP&A), financial modeling, and the future of finance. The content appears to be educational and informative, likely presented by a single host or expert in the field.
Hello, everyone. Sorry we're running a little bit late. I was having some technical problems with my other computer. So we'll start here in one minute, but if you're out there, please let me know where you're coming from. If you can confirm you can hear me, that'd be great. Again, we'll get started here in just one second. My other computer was having some issues, so I had to switch computers, and it just took me a minute. So bear with me for one second here. But, yes, please let me know where you're coming from. I see North Carolina, New Jersey. I'd love to know where you're all coming from. And we'll start here in one minute. Just getting my setup right, so there. Bear with me for just another minute here. I apologize. All right, so hopefully everybody can see me. Okay, if you haven't downloaded the deck, please go to the website, the FP and a guy. And under Resources, there'll be an Excel section, and the first one there will have the file. We're going to cover pivot tables today. So I got the deck up here. I'll share it. JC From Connecticut, we got Jeff from Dallas. Let's see, we got Houston, Atlanta. Looks like we got a lot of people from the US Today. So great. I'm gonna share my screen. All right, hopefully everybody is seeing the pivot tables. If you haven't downloaded the file, you can download it right there. Using the QR code to download the Excel file. We'll go ahead and open that, and we'll give it just one minute for everybody to download. And I'll tell an Excel joke while we're waiting. Why can't spreadsheets drive cars? Again, why can't spreadsheets drive cars? The reason is they. They crash too often. So the reason why spreadsheets can't drive cars is they crash too often. All right, so again, if you're out there, it looks like we have about 20 people or so, maybe more, counting LinkedIn and in YouTube. Let me know where you're coming from. And love to know if you're using pivot tables. Today. We're going to talk quite a bit about pivot tables. So where we're going to start, I'll do a brief introduction on myself, what pivot tables are. We'll talk a little bit about benefits, and then we're going to jump into the Excel file. So a little bit about myself. Hopefully most of you know who I am by now, but if you don't, my name's Paul Barnhurst. My Business is the FP and a guy is the business name I have. It's also kind of a moniker that I use that was done on LinkedIn as stuck. I spent most of my career in FPA, worked for companies such as Digicert, American Express and Solera. Today I create a lot of content. Some people call that FPA Influencer do training. I just did a five hour training on my best practice FP and a course. Tom, we'll be doing that again later this year. Would love to have you join us if you're interested. And then I host three popular podcasts, FPA Tomorrow, Financial Modelers Corner and Future Finance. I see we have someone joining us from Colorado. So great we have another person out there. Alrighty. So pivot tables, if you're not using pivot tables, you're probably missing out. They're a really powerful tool to summarize, analyze and organize large data sets. They allow you to group and aggregate your information in rows and columns. They have the ability to filter. And I, in certain roles I've had, there are times that I'm using a pivot table several hours a day to do analysis. And so I, I personally have found them as a great tool. And so let's talk just briefly, what are some of the benefits of pivot tables? They're great for summarizing data. If you set your data up right, it's easy to dynamically update your data. You hit refresh and you can see the new view. You can analyze the data, you can slice and dice it different ways. I want to look at it by product category or subcategory, or country or salesperson. Whatever you have in your underlying data, you can slice and dice it that way and aggregate it. Pivot charts can easily be built off pivot tables. Efficient for reporting, easy to filter your data. So those are many of the benefits. These aren't all of them, there are others. And as you learn pivot tables, you can also start to learn Power Pivot, which is the backbone of Power bi. That's also in Excel. It's where you can start creating your own data models and link multiple pivot tables together. We won't get into that today at all, Tom. We're going to focus on the basics of pivot tables. So I'd love to know in the chat if you're using pivot tables today. Let me know if you love them. If you're not really using them, would love to just kind of get an idea. So feel free to throw any comments in the chat. Also, if you haven't shared where you're coming from, let us know. I'm going to go ahead and open up the Excel file now. Give me just one second here. I had it open on my other computer, so I just need to reopen it and we'll get started. Well, I'm doing that. Daniel says some very useful. Has anyone seen or used at all the new pivot by formula in Excel? I'd love to know if anyone's had an opportunity to use that. So in addition to the pivot tables, there's now an actual formula that you can write a formula to create a pivot table. Sorry, give me one second here. There we go. And I will hopefully be able to show an example. I'm not sure if this computer has the most recent version of Excel, so I may not be able to show the formula, but we'll find out here in a minute. Okay, I. I am able to. Good. So we'll cover that later. So what we're going to cover today, what you're going to find in the file. Let me just orient you to the file. Here's a simple sample report. Example of something you could do with pivot tables, right? So using slicers, I have this pivot table and pivot chart. And all my data is going to automatically update depending on what I select. And so pivot tables and pivot charts can be handy for reporting. You can do some pretty cool stuff with them. So in this file you have that sample, we have some raw data. This is the data we're going to use today for our examples. Then what you're going to find is we're going to create a. We're going to show you how to analyze some. Some pivot tables, create a pivot table. Here there's a walk through talking about what a pivot table is, how you create one, what the different fields are in a pivot table. So give you some information Here we have a menu bar walkthrough where you just talk about the different parts of the menu bar. A pivot table. I'm not going to go through these pages. These are more kind of a resource for. You have a similar thing for pivot charts. Here's kind of a basic walkthrough of the menu bar. How to set up a pivot chart at the back of this file. We'll probably walk through just one or two of these in the time we have is there's a couple exercises so you could see what the answer looks like. All the different parts of a pivot Table we'll talk about how to create these. Then you can go through and practice some of these exercises to get familiar with setting up pivot charts and pivot tables because there are a lot of different things you can do. And then last we'll show a brief example of the new pivot by formula. As you can see, pretty long formula. I broke out each individual piece on its own, but I just built a pivot table here from an Excel formula. So it's pretty cool. Now that that's a new feature in Excel, some of you may have it. It's been, it has now gone into general release. It all depends on when your computer gets updated for its Excel releases. Are you on a semi annual, annual monthly channel and what channel you're on and how quick you'll get it. But let's start with analyzing some data. So if everybody can go to the sheet raw data I want to show kind of a cool way to have Excel build the pivot tables and analyze the data for you. So let me know if any of you ever use the XR on the home menu, the Analyze data button. If you haven't, we're going to do that now. If you've used it would love to know. Feel free to throw that in the chat. If you click on Analyze Data, notice what it just did. I'm going to enlarge this a little bit. Is it brought up the sidebar where it has ask a question about your data. Next it has suggested questions and then it says Discover Insights. So you can see here I could show 36 results. These are all different charts and pivot tables that it thought might be important to our data. So we could start here. I could even ask a question of my data. I could say what product name had the greatest quantity in any given month and it's going to analyze it and not exactly what I wanted. It gave me quantity by month and product name and sorted at highest lowest. So I can see it. And let's say I like that. Let's say that's what I wanted. I can click insert pivot table and there we go. I have a new sheet of a pivot table you can see each month here. Now I could go back so I can come back to my Discover Insights and any of these I like, if I click insert it's going to put in a new sheet here. It gave me a chart and a table. This is a great way to just quickly have Excel analyze your data. Generally you're not going to get any earth breaking insights. I usually like to build them myself. But if you just want a quick and dirty quick analysis, maybe get some ideas, ask some questions, it's a great way to start when you're analyzing a new data set. And the nice thing is you don't have to worry about building the pivot table yourself. It's going to build it for you and it's going to put them on separate sheets. So if you're not using analyze data, I'd recommend you check it out and give it a try. All right, so in addition to that, with the analyze data down here, it will give some suggested questions like, and if you click on them, it will bring up what that, you know, chart or pivot table should look like for that question. It will go ahead and give you its answer, says, here's our answer. You can also click on the, the gear icon, the settings icon, and you can choose maybe I didn't. Maybe I don't care about product type. I don't want you to analyze it. I could take it out. Maybe I want all everything to build everything you analyze to be on averages. I can do that. Maybe I don't care about month, I only care about the year. I can update it. And it will now do all of its analysis and see, it only gives 19 results there because there's not much data. But it will do a new set of analysis based on what I just told it, the fields I removed and the changes I made. All right, so that's the first thing I want to show is the analysis data. Next, I want to walk through how to create a pivot table, what the different options are when you create a pivot table and then we'll walk through some actual examples and build some different pivot tables. So again, if I come to my raw data, there are a number of different ways I can build a pivot table. I'm going to go ahead and just use the menu bar. I could use shortcuts, alt N I believe V T here. But I'm just going to go to insert pivot table, say from table range and I'm going to go ahead and put it on an existing worksheet. I'm going to put it on this creating pivot table and I'll put it somewhere here toward the top. Maybe I'll do B3 or B4. I usually like to put a a column and a couple rows in between where I put it. And you'll see why in a minute. Now, once I click ok, it's going to bring up two. Well, really four new things Excel is going to bring up. First you're going to see right here where it says pivot table 1. You can see this box, that's where the data goes. Over here you're going to see this pivot table fields and we'll walk through that. And then up here you're going to see two context specific menus. They're in green, which means they're only available when we're utilizing that object. In this case our object is our pivot table and so you can see the different ones. So let's go ahead and start. If I want to add data to my pivot table, it all starts here on the right hand side with your pivot table fields. So where that starts is you have filters, columns, rows and values. You also have a gear icon. If you click on the gear icon, it allows you to look at your data different ways. I, I prefer either the first or second one where I see everything. So I'm just going to go ahead and do this. The default that I have now, let's say product category. I want that in my filters. You'll see right here I can now filter on it. So that's a filter I have available. Next, what do you want to put in your row? Well, I want in my rows, maybe I want the product type. Stick that in a row. I can see all my product types. Next, what do I want? My columns. I want the months notice when I drag down month. Excel said, oh hey, that's a date. We're going to do some summaries. And it added new fields automatically this days off the month and this months off the month. I now have the ability to drag any of these three off. So maybe I just want by months. So now I have just individual months here. And the last thing is what's the value? Do I want to look at this by quantity, by price, by cost. I'll stick quantity here. And that's the basics of a pivot table. That's where it starts. You're looking at columns, rows, your values. This is what you're aggregating together. And up here is your filters. So those, there's those four elements within that. Basically the rest of what you're doing with pivot tables is just moving things around to try to get insights, doing percentage of totals, looking at it different ways. So what I want to do is I want to walk through these two context specific menus, explain a little bit of what's there, and then we'll do a couple actual examples. So here under design, first thing you have is pivot table styles. If anyone's attended other trainings where I've talked about tables, same idea. It's just for pivot tables. All it's going to do is change the look and feel. It has a bunch of different default ones. You can also build your own. I tend to like a light blue, so I might do something like this. You know, maybe I want a little darker blue. Go in here. But I can do whatever color I want. So we'll go ahead and stick with the blue. Next, you have these style options. I pretty much always leave these on default. But you can. You can eliminate row and column headers if you want. You see, they're all gone. You don't have to have them. I find them really helpful. You can band your rows if that makes it easier to read. You can also band your columns. Maybe we'll b. Maybe I'll leave banded rows on for now or get rid of it. Next, you have different layouts you can do. Under report layout, you have what's called show in compact form, outline form, tabular form, and then repeat your labels or not. Before we do these, what I'm going to do is I'm going to right click here, show my field list, and we're going to add some additional information to the rows. So let's say I also after product type, maybe I wanted to see product name. We'll go power source. So notice here, I've now added multiple elements. Notice this. All right, now lives in one column. You can see air purifier and then the type of purifier and the fact that it's corded or this one's cordless, you know, whatever they might be. I can see all that information. Now if I go to report layout, notice this is the compact form. If I don't like compact form, I can say, hey, show it to me in an outline form. You'll notice with the outline. And now put each of these in separate columns. So then I can. I can see each of them and individual columns. I can also do what I call tabular form. Tabular form is similar to outline form in that it's separate columns, but you'll notice it. It showed totals here. It looks. It's a little bit different in the layout. I personally prefer tabular form. I also like to repeat all my item labels. And I'll show you what that does. You click repeat all the way till the next one. You'll see that item label in every cell. You don't like it, you can get Rid of it. And so that, that's what we have there as far as layout. Then the next thing we have is totals. Do you want the. You want your grand totals on or off? So you can have them off for rows and columns on. Like if I click off, notice there's no grand total there. There's none at the bottom. You can come back, turn them on however I want. Next is your subtotals. So I can say do not show subtotals. Now you can see there are no subtotals. You know, I could come back and say, hey, repeat my item labels. Don't show subtotals. Or I can say, yeah, show all subtotals. And there they are. I and then from there that's this menu. I also have the ability to come down and do all that by right clicking. I could come in here and say I don't want a subtotal on product name. I only want it for product type. And you can see it changed the layout. I can expand or contract anything by pressing these buttons here. And so that's, that's basic layout of my pivot table. You know, I can continue to change it however I want. Maybe I want months up here. I want product type here. Probably not the look I want. Maybe I'll change it. Do product source here. And so now I can see each of my product names, product type and source. And so you can adjust it however you want. So now what I want to do is I want to run through the analyze options before we do a couple exercises. So the first thing you should always do, give your pivot table a meaningful name, the same as any table. So maybe I'll call this cells underscore data. I've now named the pivot table. Next under options it's going to bring up a menu box that gives you different options for your layout. So you can see for empty shells. You know, do I want to show zero or show nothing? Do I want to auto fit my column whips every time you update? Do you want that? I'm going to say no, just leave them however I've selected them. Display fields and report order. You could do down then over, over then down. This is very similar to what was under design. You can sit here and adjust show grand totals, yes or no? You know, what are the different displays? You want printing? I never use the printing. But you, there are some printing options, there's some data options. You know, do you want to refresh the file every time it opens? Retain number of items to retain Per field I, I usually leave these default and then there's even some alternative text which I don't use. But you'll see there's a number of options there. I'm going to go ahead and click OK because I, I said refresh on open it gave me that warning. And then next here, this is your active field. Your field settings are for your. Your data. Over here you can do different things. You can say hey, I want subtotals, I want none. How do you want to summarize your data? You want average? Do you want sum? Do you want max min? You could select multiple if you wanted. And so you could see now it gave me some count average max min for each of these. So you can do different things with your field settings. We'll, we'll get into this in more detail later. Here is the expand and collapse we talked about. So hey, I want to collapse the air purifier, the product type field. If I come over here, you can see now my active field is product name. Maybe I want to expand it and it's going to give me options. Maybe I want to collapse it. So you could start to play with these to adjust what you're looking at. We'll expand that back. Next you can group things. This can be really helpful if you want to create custom groups. So I'm going to right click here. Get rid of subtotals. And let's just say for some weird reason I want these eight products to be a group. I can come up here and say group selection. Notice it created product name two and it grouped those all together. Now I could name them and call it Group two and you could see it. It's going to group it together so you can group different things. I could group all these into one if I wanted. See, you can see right there, group one now and I can get rid of the product name so you can create your own custom groups. You can group. You could have multiple custom groups if you wanted. So you can go through and group it however you want with group selection. Now I could group maybe I want product. These product types together and I want these product types together. So I have group one and group two there. I'm going to go ahead and hit Control Z twice or Control Z undo that. Next you can insert slicers and timelines. That's what these are. Those allow you to filter using a visual filter instead of half new. Select from the drop downs. I'm not going to go into that one any further today. Next you can refresh your data. So if you're underlining data changes, you can refresh it. You can change your data source here. This allows you, if you wanted, to move the pivot table to another location. If you want to clear your filters, you select your entire pivot table. So this, these are a couple actions here. We'll come back to these later. But this allows you to create some calculated fields so you can write your own formulas. The OLAP tool is only available if you're using Power Pivot. That allows you to have some additional functionality relationships. You. If you had multiple tables, you can create relationships between your tables. Again, that gets back to Power Pivot and the data model. You could start combining tables together. Here you can build pivot charts. This recommended pivot tables. You could have it recommend some stuff if you want. Kind of similar to the data analysis. And then here is your field list. Here is do you want the plus or minus for your button? Do you want the headers to show up? So these are just different show options. So that's the menu bars, the two menu bars. Now what we want to do is we actually want to go through and set up how do you create, you know, different looks and views? Maybe I'll just leave this here for now. And we're going to go through and create this exercise right here and we'll go through and do it together. So what I'm going to do is I'm going to create a pivot table here that has me follow all these steps. So I'm going to delete this pivot table. I'm just going to. Actually, what I'm going to do is I'm going to duplicate this page. So I'm going to create a copy of it so we can keep the original so we can always look at it if we need to. And we're going to recreate this pivot table. We can see the steps that we're supposed to do. So what I'm going to do is I'm going to come back to my raw data here and we're going to insert a pivot table from table range. We're going to do an existing worksheet and I'm going to put it down here. So what we want to do is we want to look at the, the previous pivot table for a minute just to kind of get an idea. So we have product name, price, cost and a bunch of custom fields. So I'm going to put month and product name in here. So if I come back here, I'm going to put month in my filters product name in my rows. And then I'm going to add price and cost. Now we're going to show you how to create your own custom fields. We're going to start with this. In this case, we're going to create 1, 2, 3, 4, 5 formulas. So what I'm going to do is I'm going to come up here and I'm going to go to Cal fills items and sets and click on a calculated field. And if there's any questions, feel free to ask any questions. At this point, if anyone has any questions real quick, I'm going to share an Excel joke. Before we keep going, let's see what's the lucky Excel joke of today? What does every newborn spreadsheet need? Anyone have any ideas? What does every newborn spreadsheet need? The answer is formula. All right, so we're gonna go ahead and create this first formula there in row four, create the following calculated filled items. So go ahead and type the name gross margin in the name. And I realize it's really small here. Unfortunately, I don't have a way to enlarge this box. I'm hoping at some point that's a change Microsoft's making. So in the formula, my formula for gross margin is going to be price minus cost. I'm going to click add. We'll go ahead and click ok. And now you can see I have gross margin. If I was to calculate it over here, if I took this minus this, you can see it gives me that answer. One thing I want to show when you set equal here, Notice this says C33. If yours does not show C33, then you have this generate get pivot data on. If I turn that on and now I say equal C33, it shows a formula. It shows the get pivot data formula. So anyway, one thing to be aware of, you can set it equal to either of those. So there's the first formula, gross margin. Next we're going to do percentage gross margin, which is going to be gross margin divided by price. So I'm going to come back up here, going to go to calculated field. I'm going to call this percentage gross margin. And here we're going to do our that formula we just created divided by price. Oh, oops. Divided by price. There we go. We're going to add it and we can now see it's there. Now before we create, we'll create these next two and then we're going to clean this all up. Show how do we get the formatting right. These labels Correct that type of thing. So that will be our next step. So let's go ahead and now add revenue. So it's going to be the same idea. We're just going to come in here. Calculated field revenue is going to equal price times quantity. We have. So we come down here, we do price times quantity, add it, and there we go. We now have revenue. We're going to skip doing these last two. It's the same idea and we're going to move on. So now it says rename the calculated fields in the pivot table to get rid of some and if any cases you have average of. So right here you see I have price notice. If I get rid of the sum of it says the pivot filled name already exists. I'm not a big fan of having some of in these big long ones. So what you can do, there's a trick. You get rid of the sum of. Add a space at the end that price is different than the price in the underlying table right here, this column price, because you just put a space at the end. But it looks the same. So I'm going to do the same with each of these. I want cost here, I want gross margin here. And I can go through and clean each of these up. Oh, add a space at the end. There we go. So those are done. Next it says change the style of the pivot table. That's just the. The design. I'll go ahead and select this one here. Maybe, maybe we'll go here. So I've done that. Next, change the number format for each field. So here in price I can right click and I can go to value field settings or I can come into field list and I can rightclick here and go to value field settings. So in this case I just want to change the number. Maybe I want currency. No decimals. Click. Okay, and now you can see the price. And whenever I make changes, that price is always going to be correct. Now I'm going to go ahead and get rid of my grand totals down here. So let's just turn those off for now. And now I can go and do this for each of these. I can do the same with cost value field settings. Come to number format. Change it to what I want Gross margin. We'll quickly do the same number format currency and change it. You get the basic idea there. There are lots of different ways you can do this. You could highlight a whole column and do it. I like to do it this way. So I'm working on just the pivot table data in Case I have any other data, I'll usually do it here. There are some shortcuts to make it quicker, but we'll just do that. And then my last one here, the number format currency. All right, so I've done that. And then I can keep doing. Rename the pivot table so I can come here, change the name. We'll make this example one, and it says add the months group to the filter, which we did at the beginning, you know, turn off grand totals. We've done that. We got our freeze pane and it says sort by the sorted the product name by total revenue. So let me show now you'll notice you have this drop down here. You can sort things. So it says sort oldest to newest. More sort options. You sort by values. So you can come in and sort different things. I'm going to go to more sort options. I'm going to say descending. So sort the product name, which is this column, by total revenue. So I'm going to come in here. I don't have total revenue. I just have revenue, which is going to be a total cf. So just click revenue. We're going to sort it in descending order. And notice the first one there has the revenue. Next one and it goes on and down. So that's the first thing. Pivot table. This is an example of creating your own calculated fields. You could add additional fields I have found sometimes, depending on how you sort things, the numbers sometimes look a little wonky. So just always check them, make sure all your math is right, you don't have any issues. But that's calculated fields. Next thing I want to show, before we move on to the next example, if you double click on one of these, so double click here, you can look at. We'll say ch. Choose the field containing the detail you want to show. I want to show product category and it will add it. And so you can click on that. If you click on a number, it will show you the detail that makes up that number. So there was, you know, whatever the total price and cost was for that that I looked at. Like maybe if I come down here and click on floor care, it's going to show what makes that up. So that's the first example. Let's go ahead and look at the next one. Example two, and this is one of my favorite use cases is percent of. I find it incredibly helpful with pivot tables. So notice here and then we'll kind of create this is this pivot table. We have product type. We got product category and power source up here. We've looked at it by quarters in this case. But notice for the vacuum cleaner here I show 76,000 of 515,000. Here I show it's 15 of the overall revenue. And for quarter two, so I can do percent of. So let's go ahead. And what we're going to do is we're going to get rid of these three things and we're going to create, we're going to create this. So I have my product category, my power source, my product type. First I'm going to drag the month down here. And notice with the month you have the ability to group it different ways. This one has quarters, months, days, months. If I rightclick here, you can see right now it has day, months, quarters. I could also do a grouping by years. And if I do that, it adds years. And so I can custom adjust my date format. So now we have just quarter showing. So we have quarter 1, 2, 3 and 4 for these product types. What, what I want to show next is, let's say I want to look at revenue. So here I have my revenue for each of these. I'm going to quickly convert this to a currency and do what I'm going to do. And this is where I think the real power comes in. So we have our revenue is I'm going to drag revenue down again a second time. I could drag it three different times if I wanted to. And now I can look at this. This first one I'm going to call it rev. Second one I'm going to call it percentage of column revenue. And what I can do is I can right click here, come to value field settings, show values as. And I have all these different options. Percentage of grand total, percentage of column total, row total, parent total. So if I click on column total, I can now see what percentage each of these make up. And so let me, you know, there I did percentage of column. Let's do, let's try some different ones here. Just so you can kind of see. Let's see. I do percentage of grand total. And so now you have a percentage of the grand total. I'm gonna take this one out for a second and you'll be able to see, okay, that makes up, you know, whatever percentage each of them make up of the grand total. I could also do it. Let's say I wanted to do the same thing. I can do it for quantity. I could bring quantity down here and show value as percentage of grand total. So you can see this makes up a hundred percent, I can see of the grand total. Air purifiers is 1.76%. And so you can keep adding as many times as you want the same value and then look at it different ways. So I could bring this up here and I could be quantity, you know, percentage of total and start looking at it different ways. I could put this first. So I can say, okay, here's my quantity, here's my percentage of total. Start sorting it different ways. So you have many different options there that you can utilize within your pivot table. So one of the, I'd say the two things that a lot of people don't realize with pivot tables, there's multiple but that they can create their own formulas and the, the ability to look at it many different ways. These, all these show value as, as well as summarize. I could do a count if I want. I can do an average, a max a minute, a product standard deviation. All these options are available. Maybe I want, you know, the max here and so the max behind that. There's an 82, 82 on that one. Maybe I want the max quantity. I could come in here and. Okay. Of any line item. What was the. What was the max? Because there's multiple product names. So it's taking the, the max one from the cells and showing it. If I click here, you can see right there, that's the max. That 8288. I could go back here and see. Oh, okay, that's the one. That's the max. And then next, you know, you have hierarchies. You can create your own custom hierarchies if you want. So this one's looking at hierarchy, just that ability to filter it however you want. We don't have a ton of time left. So what I'm going to do is the next couple examples are same idea, but creating pivot charts. So let's say I wanted to create a pivot chart off a pivot table. I can go to insert and I can come over here and say pivot chart. And it will create a pivot chart. So let's just delete this one. And what looking at hierarchy, just that ability to filter it however you want, you're going to notice is they're linked together. If I change this to maybe only filter on three brands. This shows only three brands. If I look at field settings, so notice I now get three. I get it slightly different fields here. There's. There's a pivot tape chart. Analyze. There's a design and there's a format that's available. And I can Play on these. To adjust my pivot table, if I click back over here, I'm going to get a different field list. It's going to show filters, rows, columns, values. I click on chart, it's going to filters, access, categories, legend and values. And so you'll see there's a couple different examples here that you can walk through yourself and kind of set up. But pivot charts are just dynamic charts built off your pivot table. You have many of the same options as you do with regular charts. The last thing I want to show is I want to show a pivot by formula. And so pivot by is a new formula. Here you can see I've created a pivot table that has quantity, price, power, source, product type, category and months. So if you come right here with a pivot, if you type in pivot by, there's a new formula. This formula has 1, 2, 3, 4, 5, 6, 7, 8, 9, 10 arguments. I think it has more arguments than any formula I've ever seen. I'm sure somebody knows of one that has more. Only three are required. So first it says what fields do you want in your rows? So we're going to keep this really simple. Let's say I want the brand name. I'm going to select that. I'm going to include my header, so that's my brand name. Next it asks what column fields do you want? And so I'm going to hit alt enter and I'm going to put that on a new line and I'm going to say I want my columns to be my months. So I'm going to come over here and I'm going to highlight the month. So that's number two. Number three it wants is what's the values? Let's say I only want the quantity. I'm going to select quantity here. I'm going to highlight this column. Oh, wait, Oops, I got off one. Give me a second. I want to hit alt enter here and I want quantity to come here. So I'll highlight this. Getting in the right here. I'm going to highlight this column. Oh, wait. Oops, I got off one. Give me a second. I want to hit alt enter here and I want quantity to come here order. Hold on. Sorry about this. I want it to be right here. So now you can see. Yeah, so let me fix that. The first one should have been brand name. So there, let's add. You can see I have brand name, I have products. Data is my month. So this is my rows, these are my columns, these are my Values. If I close this now, it will return a pivot table or why is it not return? All right, well, let's see. Oh, I also need to tell it the function. Sorry, there's four arguments you have to give it. So the function is what do you want it to do? Average, sum, etc. So here I could say I want it to give a sum. I've now just built a pivot table. I need to clean up the formatting, but you can make these dynamic. So I could set it where I have a group of all the rows or all the columns or the different math stuff and feed those in dynamically to your formula and basically create a pivot table all with a formula that every time you have a new row you're not even going to have to hit refresh. There are some, some benefits and some drawbacks to creating pivot tables using formulas. One of the biggest drawbacks is it doesn't come with any formatting. Your pivot tables automatically come with formatting. You know, some other drawbacks is, you know, if you're starting to do complex stuff, you got to write, you know, quite a bit in your formula, given the fact that it has up to 10 different elements that can get a little long, but you can filter it, you can sort it, you can choose how deep you want your rows and columns to go. You can have grand totals. And so there's quite a few different options. I'm really excited. This is fairly new, so I haven't had a lot of time to play with it. Could AI do it? Sure you could. I. It's a good question. AI probably hasn't been trained on pivot table because the data source it was trained on is probably mostly more than six months old. So, Parik, my guess is you would not be able to get AI to write your pivot by formulas for you yet. Because I don't think it has it in the data set. But if it had been trained on it, yes. So Ushma, when I would use pivot table because the data source it was trained on is probably mostly pivot by couple places. If I'm constantly changing my data and I don't want to hit refresh every time I would use the pivot by two, if I want a little more control, I could see some areas where you would like to pivot by in that I can format every single row individually, do whatever I want. If I wanted to write additional kind of functions, I want to reference it. I think it's a little easier to reference areas of it without having to worry about the pivot by function. So I'm still trying to figure out all the use cases because it is pretty much brand new. The one that I like the most is not having to refresh the fact I can use a pivot table and if I add a new row here. So let's just say I take all this data, I don't know, I'm going to copy this data, I'm going to bring it down here and I'm going to change this to a new brand. So we'll call it new brand. Notice it automatically added it put it in the sort order. Now I would need to make sure all the numbers are there for every month. So right now it only has data for, you know, December. Maybe that's when the new brand was added. If with a pivot table, I'm going to have to go refresh that pivot table, I don't have to refresh it. So every time you drop in new data because it's a formula, it's just going to dynamically adjust. All right, so that's really what I wanted to cover. I want to go over just one last thing here on this, but any other questions real quick before I go back over a couple things in the deck? If there's any questions, let me know. Yeah, I'm not surprised, Ushma, that you hadn't heard of it. With pivot by there are two other formulas that they've created or functions. I didn't cover those today. There's one called percent of, which helps you create a percent of total. There's another one called group by. What. What are the differences between using custom calculation with calculated field fields when you're saying I I personally don't use calculated fields in pivot tables, but I believe if you're talking. Let me go to the pivot table here. Calculated fields are just where you can create a custom calculation. So I'm not sure exactly what your. What are the differences between using a custom calculation when you're saying I I personally don't use calculated fields in pivot tables, but I believe if you're talking. Let me go to the pivot table here. Calculated fields are just where you can create a custom with a calculated field difference between that and what. So a custom calculation is just calculation. So I'm not sure exactly what your. What are the differences between using a custom calculation, creating a calculated field within your pivot table. If you're using the pivot formula, you could go through and create your own. See, where did I have that I think I have it at the end. You could go through and create your own formulas here with the calculated field. Difference between that and what? So a custom calculation is just creating a calculated field within your pivot table if you're using the pivot here if you wanted. So let's say, you know, another benefit maybe I, I, I could, you know, do some of these type of things and I can also do them within the pivot by formula and show multiple different things. But I usually like to use power pivot if I'm doing any kind of calculated fields because formula you could go through and create your own. See, where did I have that? I think the end you could go through and create your own formulas here if you wanted. So let's say, you know, another benefit maybe I, I, I could, you know, do some of these type of things and I can also do them within the pivot by formula and show multiple different things. But I usually like to use power pivot if I'm doing any kind of calculated fields because than a pivot table but it also requires learning a little bit more. What's great is AI is fabulous at writing dax. So I'll be honest, I don't use calculated builds. I'm not a huge fan of them myself. All right, so if we come back here, I just want to close by just sharing if, if anyone's interested, some of the resources I have, and these aren't all of them, but I do have what I call the FPA Ultimate Course Bundle. It includes about 10 includes 10 hours of content, business partnering, modeling, design, data analysis, Modern Excel, it's over a hundred videos. Modern Excel includes tables, dynamic arrays and power query. And if you use the code webinar, you'll get 30% off. That's about $90. You can see testimonial there. If somebody who's taken some of our courses really loved it. And the second one here is if you just want an Excel course, I offer that as well. That one is $60 and it just includes Microsoft Excel has about 5 hours of content and I will be adding more lessons over time. So if you do buy the course as I add new lessons, you'll get those. And that's what I had for today. So I'll open it up to any other questions that people may have. We have a couple minutes left, so if there's any questions, feel free to add them and as we're waiting, see if I can find another joke here. What happens when a spreadsheet gets sick? What happens when a spreadsheet gets sick the throw up. Why couldn't what? Why was the spreadsheet constipated? Probably get myself in trouble for this one, but I'll do it anyway. Why was the spreadsheet constant constipated? Because it couldn't budget. All right, there we go. Feel free to ask any other questions. Thank you for joining today. We'll do this again in a couple weeks. If there's a certain subject you'd like for me to cover, throw it in the chat and I'll keep it in mind for a few future session. I'll send out the deck and the Excel file later to everybody who registered for the webinar. Unfortunately, Jeff, these are not eligible for CPE credit. It's quite a process to get certified with them and there's a cost to it, so it's not something I've been able to I'll send out the deck and the Excel file later to everybody who registered for the webinar. Unfortunately, Jeff, these are not eligible for CPE credit. It's quite a process to get certified with them and there's a cost to it, so it's not something I've been able to do at this point. That being said, my podcast for FPA tomorrow if you listen to a podcast and answer questions, you can get an hour of CPE credit. I've worked with an organization that's already done all the requirements, so if you're listening to my podcast FP&A tomorrow Jeff, you can get your your credit. Your CPE credit. Each episode can get you an hour of credit. It's done through Earmark. You can do I think to do at this point. That being said, my podcast for FPA to make one hour a week. So there's a re resource for you. Ushma asked for Power Pivot. In the future the video recording will be available. You can go back and watch it. It's also going to be on YouTube because this was streamed to YouTube and LinkedIn. So yes, it will be available. So yeah, Jeff, the podcast is a great way to do it. Some of my earlier episodes of Financial Modelers Corner also had CPE credit. Tomorrow, if you listen to a podcast and answer questions, you can get an hour of CPE credit. I've worked with an organization that's already done all the requirements, so if you're listening to my podcast FP&A tomorrow Jeff, you can get your your credit. Your CPE credit. Each episode can get you an hour of credit. It's done through Earmark. You can do I think. Any other questions from anybody, I can hang on for another minute or two and then if there's no more questions, we'll wrap this up. You're welcome, Jeff. All right, well, I'm not seeing any more questions come in, so we'll go ahead and wrap this up. But thank you so much for joining me. I appreciate it. And wherever you are, are at. Have a good rest of your day. Thank you.
More from Paul




Trust and Leadership Lessons for FP&A From 100+ Top Leaders with CFO Jon Laudie






