1:17

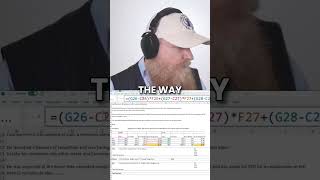
Paul Barnhurst walks through results from an automated price/volume/mix variance analysis. He reports the tool computed price perfectly (gross margin per unit $30 better), mis-computed volume (tool reported -250 but the correct volume effect should be +125), and computed mix correctly. The clip is a spoken walkthrough pointing out where an automated calculation matched expectations and where it erred.

Questions this video answers

$30 better on price (gross margin per unit).

+125 (volume effect).

-250 (the tool's computed volume effect).

More from Paul

31:52
youtube.com

The State of the Finance Stack 2026: Live Findings

today
0:54
youtube.com

A level-five FP&A team isn’t enough.

today
1:04:03
youtube.com

Trust and Leadership Lessons for FP&A From 100+ Top Leaders with CFO Jon Laudie

today
59:52
youtube.com

Excel Hour - Learn to Excel with The FP&A Guy

1d ago
1:03
youtube.com

AI can build its own rules.

5d ago
0:43
youtube.com

You can’t vibe your way through planning.

6d ago
0:41
youtube.com

Excel has survived every challenger.

6d ago
0:32
youtube.com

Vibe coding needs serious guardrails.

1w ago
1:02
youtube.com

Stop chasing tools. Learn orchestration.

1w ago
50:05
youtube.com

Will AI Replace Enterprise Performance Management? | David den Boer

1w ago
0:37
youtube.com

Stop chasing AI tools. Build workflows.

1w ago
See all content