Strategyzer rebuilt its innovation platform in three ways: embedding guidance directly into the interface instead of relying on coaches, automating workflows with experiment widgets and data ranking, and replacing manual tracking with dashboards that show coaches what their teams are doing. A new coach used the platform to guide activities without needing to build everything from scratch.
Chapters
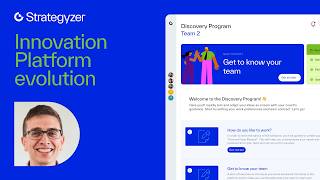
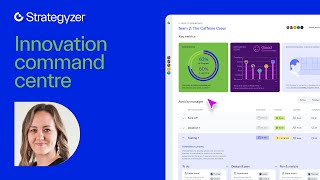
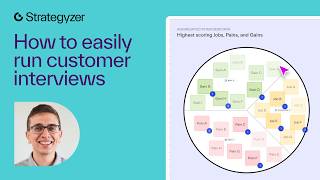
To us. But I'm going to share with you guys kind of three areas where we have kind of significantly evolved the platform. The first is around this idea of from coach as a guide to moving to where the platform can act as a guide as well. And then the second one from visual workspaces to data powered workflows. And the last one is super fun for manual progress management. So there's so much manual aspects to chasing down teams, understanding where they're at as they're taking an idea and turning it into a business as you're helping them innovate to. Now looking at some new automated coach dashboards on our platform, which. So let's look at that first one here. From coach as a guide to platform as a guide. If we look at the before scenario, if you think of us providing a service with our innovation, we're having our coaches come in and provide guidance. And the platform, once we rolled it out, it still provided guidance, but it was primarily a resource hub. It's a central place for people to collaborate and work off of. And what we're beginning to see now is a new picture where the platform has everything baked in, so it's not trapped in the head of a coach, but it's actually baked into the process and the flow. So if we look at the before picture, we had a collection of these different workspaces and these are just a couple of the categories. We had some E learning workspaces, some team and workshop workspaces, and we packaged all of this amazing knowledge into these different workspaces. But again, it still required that coach to know, when do I need to offer the team this resource? When do I need to lead them through this set of activities? And we kept refining and kept refining and if you go now to our platform, when you're at that homepage, this dashboard is what we call it, you have this sequential timeline and you're kind of going step by step through the process. And even if I was to open up and to go into some of these spaces, there's guided activities that's going to give you prompts, it's going to give you tips, it's going to help you know exactly where you are and what you need to be doing next. So that before and after transformation has allowed a massive change. And we're just seeing some really cool data points coming in. I saw this quote a couple months back and I just kind of wrote it down. But we had a coach and they were being asked to lead for the first time as an innovation coach. And they said, okay, I'm willing to do that, but only if I have the Strategizer platform. And there's just this baked in idea of that timeline, that guidance that, okay, here's what you need to be doing next. Again, it's not in the coach's head, it's packaged on the platform that allows people, even as someone who is brand new, this coach is leading right now in Australia and they're doing a fantastic job because they're able to kind of have that guidance baked in. Now, lots more I could say there, but I'm going to jump to something I'm really excited about this paradigm shift from visual workspaces to data powered workflows. So if you think about the innovation process, you're going to get your hands dirty. There's going to be a lot of work that you do. And we had these visual static workspaces where you would have and even up here you're seeing a ton of work that was done. This is a workspace where we're analyzing results from running customer interviews in a very structured way. So if I take that same view, what we now have is folks are able to use, we have this experiment widget. There's kind of these three different phases that guides you through. You design your experiment, you run and test it and you analyze it. And this is for running a very structured form of a customer interview. And now I'm here on this analysis page and I can immediately see the top job right here. I can see the second ranked job, the third ranked job, similar with pains gains and some of the context pieces that we're trying to gather. One of the biggest pain points we have with our clients is time. And the amount of time saving that we've been able to do with stuff like this is super cool. Another way in which that has happened is in the past you would be taking screenshots. So a typical scenario might be a senior stakeholder wants an update on what's happening. And like, oh, we're, we've mapped out our customer profile, we're doing some interviews, we're having these updates, we're testing these hypotheses. There's a lot at different moments of just taking a screenshot, putting it in a slide deck, putting that together. But now we have a new feature that we've rolled out this year where as I'm going down my timeline, as I'm going through the program in these different moments, it's capturing the work that I'm doing. The program knows where you're at knows the work that you have done. And then there's these moments such as this one here is a midterm review presentation and you can review with your senior leaders. You come here, you hit this button, it's going to open up this dialog box and it has a sample presentation and the ability to just download a presentation and it's going to take all of your work that you've been doing so far prior during your time on the platform and it's going to put it into a pre structured template. So stuff like this. Again we've seen significant time savings for teams to be able to not just have to hobble these things together but have it ready to go at those key moments when they want to report out. And the last one, this idea of from manual progress management to automated coach dashboards. And really I was like what, what do I even put? There's no platform piece that I can put here. So I just put an image of email communication of these back and forth where if someone did want to know. So a scenario that is typical for us is you might have five to 10 teams in a cohort and you have coaches who are helping guide those teams along. But when that innovation manager comes in and they want to know like where these teams are at or a coach is coaching three teams like where was that team for this? Where are they at? Where there's so much email communication, so much back and forth jumping in the call is chasing down together information. And what we're doing some beta testing right now with is having some coach dashboards. So this is kind of a view of it where you have some key metrics. Up here you can see there's program completion, elearning completion, we get some motivation feedback, we see progress in terms of the activities. Have they completed the stuff that they need to complete? Are we on track? And then we have progress of the business model as well. So two different types of progress. Another screen that we have ridge that coach dashboard is just providing some guidance of what's coming up. Here's some guides and information that you can look at. Here's some videos to prepare you. So like you see here, prepare for ideation workshop number one. So that in this scenario we're looking at they have a workshop coming up, here's some guidance for that and then being able to give them the information based on what's happening.