3 Powerful Bearish Candlestick Patterns
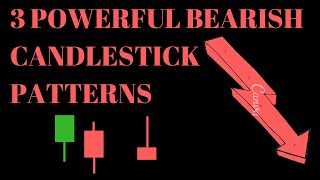
Alberto Costa breaks down three bearish candlestick patterns: the pin bar (tail at least 60% of the candle), the one black crow, and the evening star. Pin bars work best for trend-following trades, while the other two patterns suit both trend-following and countertrend setups. Always confirm with additional indicators and place stops above recent highs.
Chapters
Hi, welcome to this video on bearish candlestick patterns. The last video was about bullish candlestick patterns. So today we are going to learn the reversal. If you remember, last time we had the bullish pin bar, one white soldier and morning star. And today we have their bearish version. So bearish pin bar, one black row and evening star. Let's start with the first one, the bearish pin bar. How can we identify a bearish pin bar? If you look at the picture, it's actually the reversal of the previous one. So how to identify the bearish pin bar? Well, we want to see the tail of the candle to be at least 60% of the whole candle. And if you remember from last time, we were looking at the lower tail. Here we look at the higher tail. So this, this is the higher tail and this is the whole candle. So these higher tail must be at least 60% of the length of the whole candle. And remember from last time I say that some people use 60%, some people use 2 3rd, I use 60%, but both are possible. And again, this candle can be bullish, can be bearish, it doesn't matter. Can even be a dodgy like that where the open and close are basically the same level. Where do we want to find this bearish pin bar? Ideally near a resistance and we want to use it for trend following. So when the trend is down, why again similarly to last time, this is a one candlestick pattern so we are not so confident as for example for the two or three candlestick patterns that we see later, we are not so confident to use it for a counter trend trade. So trend following for bearish pin bar means that the price is in a downtrend and ideally if there is some kind of resistance, we want to see this candle somewhere here or another situation is when you have a price, for example that is in some kind of consolidation and then here you see the pin bar and then you expect the price to keep going down. And the other thing is that it's better if the high is higher than the previous. Sorry, this is a mistake. The previous high. Okay, so again why this is similar to what we said last time. Actually if you take the video last time and you reverse the logic, you will identify these three patterns I'm discussing about. And again the idea is that we want to see that the bull this time were trying to push the price as high as possible and then they fail and then the price close again way below the high. Let's see with an example how this bearish pin bar can Be this example is not actually the trend I told you before, it's more about the resistance level, the horizontal resistance. So there is some kind of resistance here. It's not very straight, but you see there is this zone, okay? And you see the price is eating around here, is going up and then down, up, down, down and then again and here many times. And now you see here this candle. So this can be a signal that the price again tried to break through this resistance, but it could not. So what would you expect now? Well, it's more likely that the price will keep going down. But again it may not be. It would be much better if after this candle we have another red candle, for example, like that. So if this happens, we will have more confidence that the price is actually going down. That's why I prefer usually to use the two or three candlestick patterns. But let's move on to the next one, the one black cross. How do we identify this pattern? Again, these are two candles and the first thing is that the high must be lower than the previous high. So this is the high and this is the previous row, the close. And remember, for green candles, open is below close. For the red candle, the close is below. So we want the close to be lower than the previous low. And also we want the open that is here to below the previous close, something like that. Now this candle must be bullish. And so these three are okay, bullish candle followed by a bearish one. Okay, and again for trend following, we want to see this nearer resistance for counter trend. Well, for counter trend this can be used instead of the bullish pin bar. Again because it's two candles, so we are more confident. So remember, two or three candles, I can consider them as valid signal for counter trend trades. But for trend following, sorry, but for the bullish pin bar, I only use it for trend following. So let's see this with an example. Okay, so this is clearly a downtrend. I think it's quite clear. And for example, this one. Looks like a one black cross. And if you see is near this 50 moving average, that can be one strong resistance. So you see the pattern and after that what happened? The price keep going down. Then he went up again a little and then down. And now he's continuing the downtrend. Now let's move on to the last one, evening star. So in this case we want the first candle to be bullish, the third one bearish, and the second one any color. So this can be green or red. Now the second candle must gap up. So it means again if this is the open and this is the close in this case open, close and open close. It means that this one should open above the close of the previous one. And this is the case now for the gap down. We want the third one to gap down compared to the second one. So what does it mean again that the open of this is below the close of that we want a gap and again you see there is a gap and similar similarly to the previous one. We want to see this pattern if we are doing trend following nearer resistance, but it can also be used for counter trend. Let's see an example. Well actually here I can see two, two of them. So this is one and we have another one here. So as you can see there is a gap bullish and bearish. Again here bullish and bearish. The second one in this case is bullish, but it could have been bearish as well. And we are near a resistance in this case and at the same time we are in a downtrend. So it's a kind of trend following nearer resistance. And if you notice here the price, well it went down after a while and then it went up again and after this one actually went down more clearly. So again this pattern doesn't mean that after this candle definitely there will be a bearish candle. We don't know, we never know. But the probability is that the price will keep going down. Now if you want to use this as entry signal and again remember, it should not be the only tool that you use to decide when to enter and when to exit. But for example what you may do is you may place your stop loss above this high or if you enter here, your stop loss may be here and your entry price may be below this candle. So you may enter here and here you may enter below the low of this candle. So let's recap. First thing we want to use the bearish pin bar only for trend following. For counter trend is too risky. Number two, we can use the two or three candlesticks pattern so the one black row and the evening star for both trend following and and also countertrend trades. Because here we have a kind of confirmation so we are more confident. And then as I said last time, we need to use other indicators to confirm the entry and not just rely on these candlestick patterns. So with that I thank you for watching this video. I hope you find it useful and if you have any comments, any question, please write a comment below the video and I will reply. And with that I would like to conclude and see you next time.










