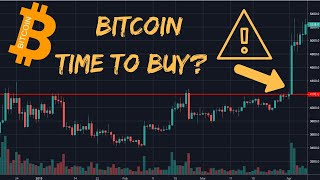
YouTube technical-analysis video (speaker: Alberto Costa) discussing whether the recent strong Bitcoin candle marks the start of a new uptrend. The speaker analyzes recent price action, identifies support/resistance zones, and evaluates moving averages (50, 150, 200). He concludes the medium-term trend remains down (despite a short-term rally), the reward-to-risk for entering now is poor, and recommends waiting for either a pullback to support or clear moving-average confirmation (200 sloping up or 50>150 both rising).
Questions this video answers
April 14, 2019
December 17 (the painful drop that started December 17th)
50, 150, and 200-period moving averages
Chapters
Hi, welcome to this new video. The topic today is bitcoin. Why? Well, as you can see here, there was recently a huge increase of price in bitcoin. You can see this very, very long bullish candle. And many people may be wondering, is it really the start of a new uptrend? Is it the right time to go long on bitcoin after the big drop in price of the recent months? Today I want to discuss with you this question. And to do that I will first start from the recent price action. In other words, what happens in the last month since the beginning of the year. And again, what we will do is to identify the key support and resistance level. And also we use the moving averages that you see here to decide what we should do. First, you may have seen that here, let me take this horizontal line tool here there was a support level. Drag this a little lower. So when you drag the support, you should be, should be the best fitting line. Now you see here, it was tested here again here three, four times. And then here is very interesting what happened. You see the volatility kind of decreases. The candles were smaller than before. And usually when you have this situation where the price is approaching a resistance level and the volatility is decreasing, then very often the breakout is very strong. And that's what happened here. You see the increase of volume, the very long candle, that's what happened. So that was a very bullish signal, of course. But let's have a look at the wider picture. First of all, you can see that around this area that again I want to show you with this line around this area. And remember, support and resistance are not lines, they are rather zones. So it would be better if I take even say this one and say that these area between the two lines is a possible resistance. Now the price was around here, it was a support, it broke down and then it was in this other consolidation phase and after this breakout. What is the problem? The problem is that there is this strong area of resistance. So the first thing you should understand is this. If I enter now knowing that here I have a possible resistance, would this be a good trade? Of course, here I'm speaking from the point of view of a trader who enter with a stop loss and with position sizing. So that's the first thing to notice. So would it be a good trade? Let's check. Tradingviews offer you a lot of tools to do this analysis. For example, you can take this long position. What do you do? You say, I would like to enter, let's say above the high of this candle. Okay, and let's say we want to take profit here before the resistance. Now what's the question? Where can I put my stop loss? I will not put the stop loss below this candle. Why? Because it's not a strong support. If I want to put a stop loss, it will be ideally below the recent support. That is this line. Right? So it should be somewhere around here. Now what's the problem of this trade? If you see here, the risk reward is less than 1. So remember, when we do trading, we should have a good reward to risk ratio. Reward to risk, for example of two means we make two by risking one. But here we have less than one. This means that if we were to take this kind of trades, often in order to be profitable, we should make sure that we are winning way more than what we are losing. So the percentage of winning should be more than 50%. Definitely more. And in trading is very hard to achieve that. So in terms of reward to risk, this trade is not a great one. Then let's check at other reasons why going long now, Bitcoin will not be ideal. Let's look at the moving averages. If you remember from a previous video, I said that one way to look for the medium term trend stocks, but the same can be applied here is to look at the 5150200 moving average and they are these three. So the blue line is the 50 moving average, the 150 is the green line and finally the red one is the 200. So what was the criterion for defining an uptrend? Either the price is above the 200 and the 200 is looping up. That's not happening because you see the price is definitely above the 200 but the 200 is still sloping down. Or the 50 is above the 150 and both are sloping up or flat. Now the 50 is above the 150 but the 150 is still going down. In other words, using these moving averages, we can conclude that we are still in a medium term downtrend. So you put together these two information. What do you conclude? We are in a medium term downtrend. Of course the short term may be uptrend, but the medium term is down. And even if we want to take a quick trade, a swing trade with stop loss and target, the reward to risk is not good. So what I will do, I will wait for now and I will wait for what? If the price is going down to this support level and then is testing this level again, maybe that could be a potential entry point for a quick trade where the stop loss will be below the support, but at this time at least the reward to risk will be much better because now we are too far from the support. At the same time, if you are looking for maybe a longer term strategy, it could be good to wait to see more confirmation for the reversal to at least a medium term uptrend. And to do so we should see the price staying above the 200 and the 200 sloping up or again the 50 above the 150 both sloping up or flat. So for now the situation is not so good. I will say of course this kind of breakout was very good because at least it seems it ended this painful drop that started December 17th but again is too early to say because the price may be bouncing around here and then keep going down. So I wanted to share with you this analysis on the bitcoin and other cryptocurrencies are having similar behaviors, at least the major ones. And this is quite interesting because you can see how the techniques we use for analysis of stocks and can be applied here as well the concepts like support, resistance and the moving averages to identify the trend. So if you like this video, please put a like subscribe if you have any question, write me a comment. I would be happy to reply and with that I would like to conclude and see you next time.