Follow the SPY (with moving averages)
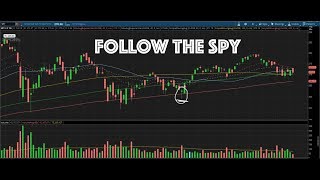
A tutorial video by Alberto Costa explaining how to 'follow the SPY' ETF using six moving averages (20 EMA, 40 EMA, 50 SMA, 100 SMA, 150 SMA, 200 SMA) to guide trading decisions. The video presents decision rules for three strategy types—swing trading, trend following, and mean reversion—specifying which moving-average relationships and support/resistance bounces to check and how many conditions must be met before taking long or short positions. The speaker emphasizes staying out when market direction is unclear and suggests backtesting or journaling these rules.
Chapters
Hi, welcome to this new video Follow the Spy. No, I'm not speaking about the spies of mission impossible or 007. The spy. Here is the ETF tracking the S&P 500 index. That as you probably know, is the index representing the US market. Why am I speaking about following the spy? It's a good idea to have a look at the S&P 500 to get a sense of the bullishness or bearishness of the market. In other words, when I'm trading, I will not take long position if it's clear that the market is in a downtrend. At the same time, I would not take short position if the market is clearly on an uptrend. Now the thing is that it really depends on the strategy that you are using. Because some strategies you may be interested just in the short term trend of the market. Other strategies you may also be interested in a longer term trend of the market. So in this video I want to give you the tools to know every day when you look at the market according to the strategy you have if you should look for long positions, short positions or if it's better to stay out. Of course I'm just speaking about stocks and ETF here because for example, if you are into options, there are strategies that can give you money even when the market is going sideways. But that's not the case here. So as you can see, I'm showing the SP the ETF spy on the Tinker swing platform. And these lines are the moving averages. And I'm explaining this in a wide but the thing is that if you don't remember, please have a look at my video on moving averages. The thing is that moving averages are a very powerful tool to identify trends. So here as you can see we have six of them. So this one, the red dashed line is the 20 exponential moving average. And this one, the blue dashed line is a 40 exponential moving average. Then we have this blue line that is the 50 simple moving average. And then we have the 100 simple moving average in yellow, the 150 simple moving average in green and finally the 200 simple moving average in red. OK so these are the six moving averages that we are going to use. Now in this video I want to speak about three strategies. Okay, so let's say you have swing trade strategy trend following, you are following the main trend and you are in and out in days, maximum week. So it's a very short term trend following strategy. Then we consider a second one that is again a trend following strategy but is longer Term, okay, maybe is a strategy where you can hold for weeks to months. And then we can also consider a mean reversion strategy, okay, or also called countertrend, where maybe your stock has for example a big drop and you are buying with the expectation of the price to go back to revert to the mean. I consider these three because other strategies, for example let's say scalping, that are very fast or very long term strategies where you hold for years, I think they are less affected by the overall trend. So we can just keep in mind this trend. Now how can we use moving averages in these three cases? Let's see this now. Okay, so we have to consider, as we said, one strategy that is a swing trade, okay? And as I said here we hold four days, two weeks. And this strategy we can go long or we can go short. So this is the first one. The second one we consider is, let's call it a trend following strategy. That is similar to the swing trade but we hold for longer term. So weeks, two months. Okay, so this is number one, number two and number three is the mean reversion. And this one usually is also fast, I would say days to weeks because usually with mean reversal you know when the price is going back to the mean many times you take profit. So you know even this one, number one and number three, often you have a take profit, but for this one, sometimes you just follow the trend and you keep trailing your stop. If you don't know what this means, you can have a look at my previous video where I explained the type of orders. So the take profit and stop and trailing stop. Now what should we look for when we are doing a swing trade? So that's what I consider. I consider three things. For the long I check if the price is above the 20 exponential moving average. Then I check if the 20 exponential moving average is above the 40 exponential moving average. And I also check if there is a bounce on support. I will explain you later with the chart that meaning of this. And finally I also check if the price is above the 50 moving average. And out of these three conditions I want at least two out of three to be true. But this one must be true. Okay, so I want two out of these three to be true. And this one for short is the opposite. So here we have price less than the 20 EMA. And then we want the 20 EMA below the 40. And we also want to check if there is a bounce on resistance and price below the 50 moving average. Again, two out of three of those are enough. Let Me show you with the chart what this means. Okay, As you remember, we are looking now at the 20 exponential moving average, the 40 exponential moving average and the 50 moving average. So for example, look here. Here we have the 20 above the 40. So that is correct. It's true. We have the price above the 22nd condition. And also we have the price above the 50, right here, for example, lets see. See here. Here we have the 20 above the 40. The price is below the 50 actually, because remember the red candle, the bearish candle, this is the open and the close. So the close is below and also is below the 20. So this is how we check the conditions, right? We check 20, 40 EMA and then 50 moving averages. And then we check the price with respect to this 20 exponential moving average and 50 moving average. And I also say something about the bounce, what do I mean? Sometimes there are very strong level of support, okay? Or resistance. And in this case you can see that the 20, sorry, the 200 moving average is a strong support because the see when the price is going here hitting, bouncing, bouncing, bouncing again here and bouncing again here. So this is another condition. When I see the price bouncing, especially with some candlestick pattern like here we have this bullish pin bar that is a candle with a very long tail and usually is a strong bullish signal. Or here you see again and again when I see that the price is bouncing on a strong support. This to me is an indication of a possible impulse for the price to go up. So if we go here we see again that we need to have the price above the 50. This is a must, is not optional. And then we have these three condition and we want two out of three. So in a way these three are indicating the short term momentum. And this one is more of longer term, medium term actually. So that's how we check. And what happens if you are doing swing trademark and then this condition is true. So price above 50 is true and at least two of these three conditions are true. Then you can look for long trades. On the other hand, if you have the price below 50 and two out of three of those conditions are true, then you can look for short. In all the other cases I will not take any position because it means that the market direction is not clear and we can see it. For example, now you see recently what happened. The market is in a kind of consolidation. So let's check the what happened here? So the 20 is above the 40, okay? But the price is below the 20 exponential moving average and the price is also below the 50 moving average. In addition, there is no strong bounce on some support. So the only if you look here, it means that this condition price above the 20 is not true. This is the only true condition. Okay, this one and this is not true. And this is also not true. So can you go for long? No. What about short? Well, if you look at short, we have no bounce on resistance. There is no resistance here. And then the other condition on the moving averages are the same, right? So the price is below true below 20 and the price is below the 50. So this is correct. Fine, but here we have only one out of three. So can we go short? No, it means that if you look at the market today and you are using this as win trade strategy at least for for me, I will not go long, I will not go short. I would just wait for the market to come out with a clear direction. Okay, let's check now the trend following strategy. Well, for the trend following I will do something similar. The only difference that now I will replace this condition. So how I check the medium term with something that is more, I would say longer term, kind of. Okay, so again we have to do the same things here. We have to consider. Let me just divide this. Okay, trend following. So for trend following, what do we do? Again we check this price above the 20 EMA. Okay, then we check 20 EMA above the 40 and the bounce on support. What we replace is the fourth condition. So the fourth condition that is the medium term trend, we do this, we check if the 50 ma is above the 150 ma and they must be flat or sloping up or the price must be above the 200 ma. And this one should be also flat or sloping up. So now what I do, I check this four condition and I want three out of four true. Okay, so look at the difference here we need to have the price above the 50 and two out of three true. Here we replace this condition with this one and we want three out of four. Okay, I think I should have used more space. Anyway, for the short trend following is similar. So we want price below the 20, 20 below 40. Bounce on resistance and also 50 below the 150 and both flat or sloping down or the price below the 200 and the 200 flat or sloping down. And again we want three out of four troop. So let's check again with the chart if we can take some of this trend following position. So let's look here. 20 is above 40 EMA. Okay, price is below the 50, price is below the 20. And what about the short term, well, we have the price above the 200 sloping up and also the 50 above 150 sloping up. So if we check our conditions, it means that this one is true and this one is true. And here this one is true. And I think this, that's all. So can we go long? No, because we have three out of four. And can we go short? No, because we have one out of four. So even for this strategy, as of today, we could not take any position either long or short. What about mean reversion? So for me, reversion, I'm not really concerned about the short medium term trend. If you see here, for the medium term trend, I take a condition that is more relaxed in a way. I just want the price to be above the 50 here since my holding period is longer, I want something stronger for mean reversion, I don't care. So what I will do for mean reversion, I will just check these three conditions and see if two out of three are correct. So I will basically do the same as win trade without this price over the 50. So let's write it again. Price above 20, EMA 20. And bounce on support. And again we want two out of three here. Price below 20 or 20 below 40 and bounce on resistance. Two out of three. Okay, and since we have already done this here the only condition true is this and here the condition true is this. So we have one out of three. One out of three. What does it mean that today I will not take any position at all? No, short, no longer. Of course I'm speaking about trading methodology where you are just following the trend. Of course, if you are managing a portfolio, doing hedging, where you have a lot of long position and you want to hedge, this may not apply. But this is just to give you an idea because many times when you look at the market, you don't know, you have many strategies maybe and then you are wondering should I look for long position, should I look for short position, what should I do? And in a way it's good because if you see recently the market has been quite uncertain. So it's probably it makes sense to stay out. Now. When you were here, for example, it was very clear uptrend. So here you would have taken just long positions, right? What about, let's see, this one for example, this may be interesting, interesting to check what would you have done here? Let me take this here, This day. So let's check, Let's go here again and let's see what are the conditions that are true. Or false. So we can see which strategy we should have taken. Okay, first, first thing, let's look at the exponential moving average. Here we have the 20 below the 40. Okay. And also the price is below the 20. So the 20 is below the 40. 20 below 40, 20 below 40 and the price is below the 20. Okay. So it's quite bearish sign. True. But this candle is also. Okay, we are also below the 50 and we are bouncing on the 200. Okay. So we are below the 50. So this is true. And we are bouncing on the 200. So below 50, below 50. And then we have bounce on support. Bounce on support and bounce on support. Okay, and what about the medium? Okay, 50 is above the 50 flat or sloping up? No, but the price is above the 200 sloping up. So this also is true. Right? Okay, so what could we do? Technically it was not good for a long term. Why? Because we don't have two out of three. And this is not true. This also not good. Not good. The only one that I can see, actually there are two is this one a short mean reversal or a short swing trade. But what happened the day after? Well, the day after actually the price bounces up. So probably if you enter a short position, it would not have been triggered because there was a very strong impulse. But let's see what would have happened if we look at the market the day after. Right? So what is the difference now is that the price is closing above the 20 EMA. Right. So now if we look at this situation, the price. Is actually above the 20. Exponential moving average. Right. Is not yet above the 50 and the 20 is still below the 40. So what happens is that now you see that the swing trade short and the mean reversion short would have been invalid. You would not have looked for, for other strategies from the. Sorry, you would not have used these two strategies anymore. But you could have started to use what to use these two. Right, because now we have three out of four and two out of three. Right? Because still we have this situation of bounce on a support and then it's bouncing up. So when it's bouncing up, you can consider also the second candle, right? If there is a kind of confirmation candle that the bounce was a real bounce. So now you are more confident and then you can take. And then you can take long position. Okay, so this is basically how it works. You can have a look, you can write down these conditions. That's not for sure the only way to do that, but it's just to give you at least a set of rules that will clearly tell you okay, I can go and check for long or check for short or nothing. Of course it's not perfect. I wanted to show you this example where there was the bounce and then the price went up. Right. So here you still don't look for any long position, but the day after, yes, you start and sometimes when you have the bounce, but still the other moving averages are telling you that there is a downtrend you may have situation like here you see the bounce. Here there was a bounce but then the price went down again. Yeah. So my suggestion is you can use this condition. You can, if you have a trading journal that I really suggest you to have, you can go back and check if applying these rules you would have avoided to take trades that eventually became losing trades. And you can also adjust these settings to suit them to your strategy. So that's all for today. Thank you for watching. If you like this video, put a like subscribe to the channel and if you have questions, you can write a comment. See you next time.










