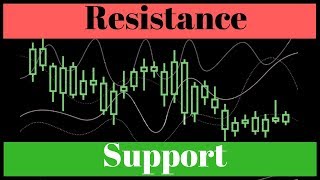
How to spot horizontal support and resistance zones on stock charts using Thinkorswim and Finviz. Three or more bounces at the same price level make a zone stronger. Automated screening has limits, so you still need to look at the chart yourself.
Chapters
Welcome to this new video on support and resistance. So what are support and resistance? Well, they are two of the most important concepts of technical analysis. And I think the best way to explain is by showing to you. So let's do it right now. Here you can see the Tinkors Ring platform. And specifically we are looking at the spy, that is the ETF tracking the S&P 500. Let's look at this first. You can see here when the price was reaching this level, then it bounced and then it went down. And then the same happened here you reach this, you see around 280 bounce and then down and then for a third time before the trend broke down. So let's identify this area with the rectangle tool here. See, there was the first, second and third bounce. So here when we have this situation where the price is bouncing for at least three times, and this is important at least three times. Why? Because you can always find a way to connect two points. But three points is already more difficult. So when we have an area where the price is bouncing from below three times, we call this resistance. And remember that this is not a line, okay? It's more or less a zone like here. So why is this important? Well, it's important because when you see this line, you have to be careful, especially if you are long. For example, let's say that you buy here and then you are holding. If you see the price reaching this level, you may consider to sell for profit. Why? Because it's more likely that the price will hit this level and bounces down again. Now it doesn't mean that it will happen. There may be a breakout, we don't know. But this is a level to control because it seems that in this area the sellers were stronger than the buyers. Okay, you can also use this resistance level to short sell. For example, if you see that the price here is creating some kind of bearish pattern, for example, you see a red candle, then you may consider short selling. Okay, so this is called resistance. What about support? Well, support is the opposite, is when the price is eating from above a level and then is bouncing up. An example of this is here. Let me zoom in. So as you can see here, what happened? The price was bouncing one, two, three times. Okay, so you see the first one, the second one, and here the third one, and then it went up. So this is another interesting area and is a support area. Why? Because every time the price was reaching this level, then it went up. And especially you see here these very long tails, meaning that the price went down, but it was rejected and then it closed way above, as if the sellers were trying to push the price down. But there were so many buyers here that eventually they were able to win and push the price up. So again, for the support, same concept is not a line is a zone. And it may be used for opportunity to go long, right? Maybe here you may place your stop loss below the low of this, maybe below this low and then you can enter here. Or if you were short selling somewhere like here, you may take this level as profit target. Now you may be wondering, okay, very nice, very easy to see. But how can I screen for support and resistance pattern? Okay, to do that we can use again finviz that I have introduced in the past. And let me show you how you can do it. So this is the finviz platform. We go to screener and here on signal we choose horizontal support and resistance and we get 96 results. If we go to charts, you can see the charts. And the idea here is that Finviz will identify stocks or ETFs that are near a support level or a resistance level. Now this is not hundred percent accurate. Why? Because as I said, identifying visually this support and resistance levels is easy, but coding these conditions is not so easy. So you see, some of them are not really like this one is not really a good support or resistance level. Others are better. Okay, and then you can scroll down. But what is the problem here that we have too many result. So what you can do, you can go here all and then you can input other conditions. For example, we don't want things like that where the chart is very. You see a lot of broken candles and probably the volume is not so high. So we can for example screen for charts where we have enough liquidity and you see the results are better. And also we narrow down to 30 now and here you can look for your support and resistance. Like this seems to be a resistance level, right? For example, yeah, you can see there is this line, this roll touch, 1, 2, 3, 4 times, 5 times. So this may be a good opportunity for short selling, for example, right? Okay. So horizontal support and resistance is one. We have another one in finviz that is called channel and you can find it here. So when we click on channel, we get another set of results. And more or less the idea is similar. Channel is when you have support and resistance and the price is bouncing within these two levels. So for example, here again we may be close to a resistance. Some of them you see that the price is already breaking the resistance or breaking down the support so they may be good opportunities for breakout. Okay so you have seen now with finviz how we can identify these setups. What I suggest you is to save here your condition. If you create a free account with finviz you can save your screener and then every day you can just quickly go through the charts and then see if there is any pattern that you like. The last thing I want to mention is that support and resistance are not the only. Sorry, the horizontal support and resistance are not the only support and resistance levels. Moving averages can be support and resistance as well and I mentioned them in a previous video and another one can be the trend line that is basically the same concept of support and resistance but is not horizontal and I will speak about that in the next video. For now I hope that you found this video useful. If so you can subscribe to this channel for big update when I will upload other videos and see you next time.