How to find winning stocks for free with Finviz
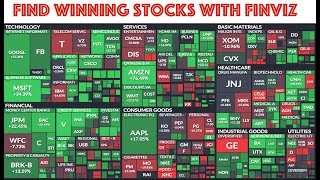
A short tutorial (YouTube) by Alberto Costa demonstrating how to use Finviz (finviz.com) to research the U.S. stock market. Covers the homepage market snapshot (Dow, NASDAQ, S&P 500), heat maps (S&P 500 by sector), market/group/industry performance, insider trading reports, ETFs, portfolio tracking, futures/forex overview, and—most importantly—the free stock screener (filters: descriptive, fundamental, technical) including saving screeners.
Chapters
Hi. Today I'm going to show you a very useful and free tool that you can use to do research in the US stock market. And this tool is Finviz. You can find it@finviz.com and this is the home page. You can see here. The first thing is the representation of the last day performance of Dow Jones, NASDAQ and S&P 500 that give you an overview of the US market. And as we can see it was quite bearish. Here you can see some signals like the top gainer stocks, those who move up a lot, the new high. So stocks making a new high. And then you have other signals. On this side you have the top losers, for example, the stocks making new low. And here we have other technical signals, like for example stocks that are touching some kind of support, like this one. You see the blue line, the support or resistance, the purple line. And we have a lot of signals. Then we have news. Okay, we also have quite interesting the insider trading. Because when stock company is public listed, insider trading must be reported what insiders are buying and selling. And here you can see the information. And this one on the right is representing the 500 stock of the S&P 500 and is giving you an overview of the market. You can see it was quite bearish. There was a big drop yesterday. If you want to see better this, we can click here on maps. So now you can see again these 500 stocks here, the S&P 500 and they are divided according to the sector. So we have the technology sector, services, basic materials and so on. And inside each sector, if you click for example here we can see the industries. So for example Google belongs to the technology sector and Internet information providers industry. And this one is the one day performance. You can change it here you can have one week if you want, or one month, three months, up to you. And not only for the S and P. You can also have an overview of the situation worldwide. Right? So the stock market in different countries. And you can also see the whole US market, not only the 500 stock of the S&P 500, but the all market. And also if you want we can have a look at the ETFs. Right? So that are these instruments that are tracking something they may track like the, for example spy is the index track. Is the ETF tracking the S&P 500. We have other ETF trackings, commodities or oil. There is a lot. What else? Groups. Now if we are here in these groups, we can see the performance of the different sectors of the US market in the last day, week, month and so on till one year and year to date. And how can you use this information? For example, you see here utility sectors was the worst six months based on six months performance. But three months it was going up a little. And here on the one month performance is the top and one week is also in the top two. So you see this utility sector is moving up and it may be a good sector to look for long opportunities. You can also check the industries, but this is less intuitive because we have I think with Finviz 197 Industries so it's less clear to have a better overview. But again as for sectors, you have one day, one week, one month and so on. So let's go back to sector. This is the bar chart. You can also have here the overview valuation, that is mostly fundamentals performance. That is the same information we have seen in the bar chart, but in a tabular way. And then you have other ways to visualize data. You can have this one, you have grid, you have chart, it's really up to you. Then we have portfolio. So here you can write the tickers of the stocks ETF that you bought or if you short sell is also possible when you buy the number of share price. So basically this can help you keep track of your portfolio. Here we have the insider information. Okay, so what the insiders are doing, are they buying, selling, how much? And if you are interested in futures and Forex, we have also something here. Right? So these are the filters and again we have the performance. We can click here also. And for forex same we have also backtest, but for this you need to pay. Okay. In any case, I think that the most important feature of finviz that is also free is the screener. And this is really useful when you want to specify some conditions to filter out stocks from the full list. So here you see we have 7,158 stocks and we can define some condition here. They can be descriptive, fundamentals, technicals, all is basically a combination of these three. For example, we have seen before that utility sectors is moving up. It may be good for long opportunity. So here I can say just show me the stocks in the utilities sector. And you see that already from 7,000 stocks we reduced to 111. What else can we specify? Well, for example we may want to have liquid stocks, let's say average volume over 200k. And you see that again we reduced to 83. Now what about fundamentals? Well, fundamentals is stuff like the price to earning ratio and if you don't know what is the meaning of this, you just put your mouse here and you wait and you will see an explanation. Right? So the price to earning is the ratio between the price of the stock price and the earning per share. And earning per share is here, right? So you have the this year, next year, past five years. And what is earning per share is the total earning of the company over the number of shares. I don't want to give you now, you know, to explain all this, but let's just try just to show you how finviz work. Lets say that we want stocks in the utilities sector with at least 200k average volume having also a positive estimate for the earning per share next year. So how can we do that? We say positive here and we reduce already to 66. What about the technicals? Well, I would say that technicals are less advanced than fundamentals. We have less stuff here. But still we can find something useful. For example, we can specify some candlestick, some pattern, also some condition related to the moving averages. If you watch my video about moving averages before, you will remember that one of the way we can define an uptrend is when the price is above a moving average and the moving average is sloping up. Now we cannot specify that the moving average is sloping up. But for example we can say that the price is above the 200 day moving average. Okay? And you see now we reduce this list to 1212 stocks. And if you click here on all, you will see all the condition, right? So again we have utility sector earning per share growth next year, positive price above the 200 moving average and 200k the volume average volume above 200k. So we have 12 stocks, right? And if you want to see one of them, you just click here. Okay? So you will see the chart and you will see the information, right? And again the volume is above 200k, the average volume, the earning per share next year is positive. This one belongs to the utility sectors. So basically everything that we specified in the filter is respected here. If you go down you will see here the rating for from different banks. For example news related to this talk. So if we click we can see the details of the news, okay? And here we can also see the insider transactions. And if we click on one of them we can also see the details because by law insider need to specify if they are selling or buying the US stock market. Okay? And last thing is, if you have your conditions free here, right? And you create an account for free, you can also save this screener okay. And when you save the screener, basically every time you login and you want to run again the same screener, you just need to select it from here and you don't need to specify all the conditions again. So that's all for finviz. Maybe in the next video we show you how you can implement a real strategy combining finviz and some other free tools. If you have some question, you can write a comment. And if you like the video, please subscribe to this channel. See you next time.










