Moving Average: identify trends using moving averages
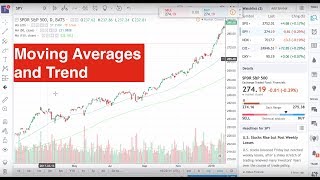
Alberto Costa explains moving averages and two ways traders use them to spot trends: price crossing above or below a single MA, or a faster MA crossing above a slower one. He covers common periods like 20, 50, and 200, the difference between simple and exponential MAs, and warns they give false signals in choppy markets.
Chapters
Hi everyone, welcome to this video on moving averages. What is a moving average? Well, a moving average is a tool that can help us identify a trend when the market is in uptrend or in downtrend. Using moving averages can show this trend clearly. And when we compute moving average, we need to specify a number. Okay, so look for example at this chart where is the spy. Sorry. Is an ETF tracking the S&P 500. And these are daily candles. Suppose we want to compute the five days moving average. Okay, let's call these candles candle 1, 2, 3, 3, 4, 5 and 6. And suppose that this day, the day of candle 2, we want to compute the five days moving average. What we have to do is we need to take the last five candles. Okay, so 2, 3, 4, 5, 6. And let's call C2 the closing price of candle two. C3 the closing closing price of candle three. And so on moving average five here at day two is C2, C3, C4, C5, C6 over five basically represent the average price the last five days. Okay, now what happens next day? Well, next day we are here again we use the same rule. So we have to consider the last five candles. Now the last five candles are candle one to candle five. And the moving average is computed as this. Right? So the sum of the closing price of candle one to candle five over five. So what happens is that we drop, you see the last candle and we take the new one. If you look at these two, you will see that the difference is this. Right? We lost candle six. And we have taken candle one. And this is how moving average works. Every new day we drop the last candle and we take the new one. Okay, this is the main idea. Let me show you how. Looks here. I'm using TradingView. It's a very nice website where you can see a lot of charts. And if we want to add a moving average, we go here and we look for moving average, this one. And this blue line is in this case the nine days moving average. So let's go here. You see, you can change this number. For example, let's put 50 and also the source by default is the closing price, the price that we use to compute the average. But it can be also open or high, whatever. But usually close price is the default. So we use close price. Now this blue line now is the 50 days moving average. And let me also add again the nine days. Just want to show you something. So let's put this in green. Okay, so if you notice when the moving average is the nine days Moving average is following the candles closely. And this is true in general. A shorter window, like a smaller number here means that the moving average is closer to the candles. And usually people employ faster moving average like the nine days to identify short term trends. And people use moving average like the 50 under 50 or 200 for medium to long term trends. Now, how can we use moving average to identify trends? There are two ways. The first one is we can compare the moving average line with the candles. And an easy rule to understand if we are in an uptrend or downtrend is that when the candles are above the moving average and the moving average is sloping up, then we are in an uptrend situation. At the same time, when the candles are below the moving average and the moving average is sloping down, then we are in a downtrend. So we can write this down. To remember, Uptrend is when we have the price, the candle above. The moving average. And the moving average is sloping up. And we have a downtrend when the price is below moving average and the moving average is sloping down. So this is the first way we can use the moving average. And here for example, you see that the price is almost always above the moving average. There was a big drop here, but the slope is still up. Okay. Of course it really depends on the strategy you are using. Okay, if this is for, if you use moving average for identifying shorter term trends. Sorry. For example, here maybe you can use some moving average like 10, 20. And you will see that here is looking down. If here I put 10, then you can see that, you know, moving average is looping down and the price is below. So this is a shorter term downtrend. But if we use the 50 then we are still in an uptrend. Okay, so it really depends what is your strategy? There is another way we can use moving averages to identify uptrend or downtrend. Basically what we need to do is to combine two moving averages, one shorter and one faster and one slow. So usually for a medium to long term trend identification, a very popular combination is the 51:50. So let's use another moving average. We can. This is the 150 and we can have this in green. Okay, so what is the rule? Now the rule is that when the moving average, the faster one is above the slow moving average and both are sloping up, this is an uptrend. And at the same time, when in this case the 50 is below the 150 and both are sloping down, then this is a downtrend and we can see that here we are still on an uptrend. Here we had, you see here where there was this crossover, that would have been a downtrend signal. Now here the 50 crossed above the 150, but the 150 is still sloping down. Okay, so we could have identified a new uptrend only here. Now this situation is something I will discuss later. Also is showing one of the issues of moving averages. That means it's very good when the market is clearly in an uptrend or a downtrend. But when the market is in consolidation, so is in a kind of range, then you can have a lot of crossovers like that. So signal, for example, to enter or exit to uptrend or downtrend. So when you are in a consolidation, it's better to ignore moving average. But we will see this later. I want to show you something. Let's go to 2009, When there was the big drop in the market, the crisis, right? 2008, 2009 here already beginning of 2008, we had a signal. You see the 50 is crossing below the 150 and they are sloping down. So this is a signal of downtrend, right? And if you look at this. Here, the price keep going down, down, down. And the recovery was only signaled here in mid-2009. So this means that just by following this simple rule, you would have avoided to be invested with long position in this big during this big drop. Okay, so let's write here the second way we can use moving average. So when the moving average, I call it fast, okay, is above the moving average slope. And. Both of them are sloping up. Similarly, the downtrend is when the moving average fast is below the moving average slope. And both are sloping down. Okay, so these are two simple ways we can use moving averages to tell us if we are in an uptrend or a downtrend. And again, how many days the number that we want to use as parameter for the moving average, like 50, 150, 210 really depends on the strategy that you are using. Actually, there is something else that I want to point out. When you are looking for shorter term trend, you may even use another kind of moving average that is called exponential moving average. And I can show you here moving average exponential. You see, let's use the 50 again, Light blue. So you see, the difference is that this moving average is closer is following closer the price. Because the exponential moving average is not as the simple one where you just compute the mean of the last. In this case, 50 days. But in this case you are giving more weight to the recent price. So when you are using moving averages for medium to long term, you can use daily simple moving average. When you are using shorter term, when you want to identify shorter term trends, then you can consider using the exponential moving average. Okay, let's take again the 150. Okay. Green. Now there is something that I mentioned before. When there is a situation where the price is consolidating in a range, moving average cannot be really used because we are not in clear uptrend or downtrend, right? So let me show you an example. This one, right? So you can see here there is a clear consolidation. There is this level of resistance where the price is hitting and then going down. And there is also a clear support around here. Remember, support and resistance are not lines are zone. But it's clear that the price is moving in this range. And when it's bouncing here, then it's going up. When it's bouncing here, it's going down. You see. And in this case, one technique could be, you know, you want to buy near the support here. If there is a bounce and you want to sell near the resistance. Okay? Now in this case you can see that there are many signal here, there is a crossing. Well, here actually is true that the price is the moving average are still sloping down. So we are according to the moving average rule, we are in a downtrend. But if you use this rule, you will not buy here, you will not buy here, you will not buy here because the moving average saying that we are in a downtrend, right? So if your strategy is not just a trend following strategy, but is also considering these situations where you want to buy near support and sell near resistance and you have this situation of consolidation, then you can ignore the moving averages. Okay, So let's recap how we can use moving averages to identify uptrend and downtrend. The first one is when the price when the candle is above the moving average and the moving average is looping up, this is an uptrend indication. And at the same time when the when the price is below the moving average and the moving average is sloping down, this is a downtrend indication. The second way is when the fast moving average is above the slow moving average and the moving averages are sloping up. This is an uptrend and a downtrend is again when the fast moving average is below the slow moving average and they are sloping down. And I will use this as a filter means if you want to go long you want to be in the situation where you are in uptrend. I will not use this just to decide to buy and sell. What I mean is, for example, here in the. Let's take again the S and P. So some people can use the crossover, for example this one, they can decide, okay, we were in a downtrend, now the 50 is going above the 150. Then I can buy here. I mean, you can, but I rather use the moving averages for. For filtering. So to tell me, okay, now that this moving average is telling me that we are in an uptrend, you can look for long position. But I don't take this as signal. It's not enough. It's better to combine with other indicators, other techniques, candlestick to have something that is more reliable. And again, as I said, remember that this can be used when there is a trend. So when we are not in a clear consolidation. Because when we are in a clear consolidation, we may have a lot of false signals. Last thing I want to mention is that which one of these two shall we use? You can decide to use one or the other. Or another thing that I suggest you to try is to take the one that comes first. So for example, if you're looking at an uptrend, you can look at the two moving averages and also you can look at the price when it's going above the moving average. And whatever comes first, you can take it as a signal. So with this I conclude the video. Thank you for watching and if you like it, please subscribe to this channel. See you next time.










