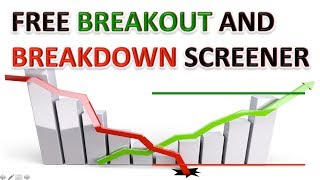
Alberto Costa shows how to use Finviz to find stocks and ETFs breaking above resistance or below support levels. The screener identifies potential trading setups by filtering for price action at key technical levels.
Chapters
Hi, welcome to this new video. Today we are discussing how to screen for breakout and breakdown opportunities in the US stock market again for free. And we are using again this very powerful tool, finviz. I made a video in the past to introduce you to this tool. But today we are using it to look for breakout and breakdown opportunity. And you will see that it's very easy. So how to do that we go here. Finviz.com is the website that I as I said introduced last time. But I will put again the link in the description and we go here to screener. Now what we are interested in is first we go to all. So we have all the settings and we have to click here on signal. And there are two possible signals that are interesting from a breakout and breakdown point of view. And I remember to you, breakdown is when the price is going. Let me show you what I mean. Just a recap. Breakout means that you are here, right? Maybe this is too thick. So the price is going like hitting this resistance level many times and then eventually is breaking out. So this is a good opportunity to buy. What is a breakdown? Well, breakdown is the opposite where the price is hitting the support level many times, at least three ideally. And then eventually is breaking down. So this will be a good opportunity for shorting. So how can we screen for those setups? Well, we just need to click here on signal and we are interested in two of them. One is this horizontal support and resistance. Okay, you already see that from 7,000, more than 7,000, we are now at 98 and we can add some other conditions. For example, as you remember, probably we want to avoid penny stocks. So here you can have over 5 or over 10, depends on your preference. And also we want liquid stop. So let's put at least. And already with this setting, you see, we have only 42. So what can we do now we can go to charts and we can have a look like. See this for example, let's open in another windows. This is interesting. So can you see what happened here? Now here. The price was testing this support level here. Here I will say here as well. And then if you look here, the price broke down, right? So the setup was something like 1, 2, 3 and then boom, crash. And if you notice after the price broke down is now testing this level again. Now this level was a support, now is a resistance. So what can we do? Well, one option would be to enter here with a short sell position and we place our stop loss above the support level. Okay, so our stop loss is here and our entry May be something below here. So we can enter here with a short. Okay, now let's see if there is something else interesting from. From the screener. Well, the thing is that you just need to check and visually would be very easy to understand if you are breaking a support or breaking out a support or breaking down. Sorry, breaking up a resistance or breaking down a support. And if you remember my video on IBuy and there was an ITA, these two ETF, they were two ETFs that broke out and I found them with this screener. So here it seems there is not. Oh, maybe this is another possibility of breaking down. I guess now it's easier to find stocks that are breaking down because the market is bearish, as I explained in another video. But here you can also screen for etf. You know, it depends what you are interested in. You can go here if you want ETF you can click here. Otherwise with the default setting you are looking at stocks and ETF everything. Okay, the other one that I want to show you is channel. Okay, so similar idea, you keep this price and volume setting as before, but this is just another signal and this is done automatically by Finfiz. That's cool because we just need to focus on looking at the result and see if we can identify some good setup. And again, maybe. Well, this one, not really. Yeah, usually you don't find everyday good setups for this. But when you find it may be interesting or you may even put something, let's say this one, you may find something that is not yet at the level of a breakout. So you see here we have tested 1, 2, 3 times. So this is something that potentially you can put in your watch list. And if later there will be a breakout from this resistance level, then you can consider entering. Okay, so that's what I wanted to share with you. Again, the setup is the price, the average volume and you can check the channel or the horizontal support and resistance. And with this I want to conclude this video. Thank you for watching. If you like it, please subscribe. If you have comments, please write and I will reply to them. And thank you again and see you next time.