Trade analysis: ascending triangle by Redart
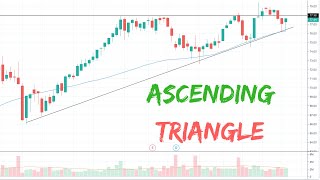
Redart walks through a long trade setup using an ascending triangle pattern on a $10,000 account. He checks the 50-period moving average, rising trendline, and sector strength in financials and healthcare facilities, then sizes the position for 1% risk and enters the order in Interactive Brokers.
Questions this video answers
April 3, 2019
$10,000
1%
77.75
78.00
Chapters
Hi guys. Today I want to discuss with you another possible long trade that identified. But before that, let's have a look at the S&P 500 to understand what is the overall trend of the US market. As you can see, recently the price has been increasing and there was a resistance level that we can see around here that was tested a few times. And eventually the price was able to break out. There was a retracement and eventually it even gapped up. So that's a quite bullish indication, meaning we can look for long trades. And today I want to discuss this one. Well, So now the chart should appear here. And this is the chart. Now the blue line is the 50 moving average. And you can see that recently it was a strong support because it was tested here, Here, here, and finally here, three times at least. And also you can notice the following. The movement of this stock has been really in waves like impulse and retracement. And then you have another impulse and then another retracement, and then again and again. And every time you notice it's making higher highs and higher lows. So that's good for trend following is a good movement is not overextended. And on top of that, now we are really close to the support. So it's a good entry point, in my opinion. The only concern I have here, this, if you look at the at the chart and you go back, you may notice a possible resistance level. I'm sure you have seen it already. It is around, around. So it was tested here and then again here and then again and again. And then you may say, okay, if there is this resistance and the price is below the resistance, isn't it risky to go long? Because yeah, you're right. If you look at the price here, you will see that we are really below the resistance. So it may happen that we enter here and then the price hit the resistance and then goes down. But in this case, I'm willing to take the trade for a few reasons. From the technical point of view, yes, it's true we have a resistance. But notice something, every time the price is recently going up, you see it's going up and now here is staying around this level and then it's going down. But it seems that the sellers were not able to quickly push down the price here. Then after that, what happened? The buyers send the price up again. We are near this level. The price went down, but it went down at a level that is higher than the previous one. Meaning to say the sellers are not able to push the Price down as much as before and after this happened, you see that the time for the price to go up was even less, meaning the buyers were able to push the price up faster. Then it kind of break here, it stayed around here and then it went down again and again. Here the low is higher than the previous one. So this is telling me that we have a situation like that where we have a resistance level and then we have support that is increasing. So the price is going here and then going down and then here and down and here and down. And this kind of pattern, this is called ascending triangle, usually lead to a breakout. So that's one of the reason why even though there is this resistance level, I am kind of confident to take the trade. You also see here that the moving average is not the only support. There is also a trend line that you can see here connecting the lows. And this is the triangle that I was showing before. So we have a very strong support that is increasing and then the price was also hitting the resistance breaking out. And now is retesting the support. Also notice that the last candle, this green candle, has got a higher low compared to the previous one and also higher high. That is a bullish indication as well. In terms of fundamentals, let's have a look at this company. Financial sector, reit, healthcare facilities, industry and the numbers here are quite good. The earning per share this year, next quarter and this year are positive. This year is quite good. Next year is not as good, but next five years is good. Sales and earning per share quarter by quarter are also quite good. So except this overall I have to say is pretty good. And especially for a quick trade where we don't want to hold for many months, I think this is good enough. If we look at the sector financial, you will see that the sector is also bullish with the price above the 50 moving average. Same for the industry, the price is above the 50 and is actually testing the 50, so it's quite good. Moreover, if we have a look at the ibd, the Investors Business Daily, we see that the rating for the EPS is also quite good. 91. The maximum is 100. So all these are information that you can use to be more confident about your trade. Now if we want to place the trade, what should we do? Well, if you remember from last video, I have prepared this Excel file that we have to fill to know how many shares to buy, where is the target and the other information. So let's assume again that we have a 10,000 capital and we want to risk again 1% what is the entry stop? If you remember, entry stop should be above this high. Now this high is 77.70. You can read here. So 7770 we can pull 5 cent above. So the stop here is this. What about the stop loss? Well, the stop loss in this case of course it should be below the support. We can put one ATR below the support, right? And the support is the moving average. So we can say. Okay, the Moving average here is 76. We can read here 76, 26. What is the ATR? Okay, we can check the ATR here. 128. Stop loss is moving average minus 1 ATR. That is 7,498. But let's have a look again here. 7498 is around here. I prefer to have the stop loss a little below the previous swing low here since it's not too far because it's a stronger support. So if it may be that the price is going down and hitting again, the resistance, sorry, the support that is this low. And this is especially important in this case because we are close to a resistance level. So it may be a risk factor. That's why in this case I rather put my stop loss a little lower below this level. So the low here was 74.47. Maybe we can put a few cent below. So we can replace this to 74. Maybe 3 cent 44. Okay, and now we have everything. We have the entry limit, the target and the R and the number of shares that we have to buy. So again, what do we have to do now? We can place the order with interactive brokers, for example. So again we go here. This is my demo account. What we have to do is buy how many shares? Well, 30 shares. Here we write 30 and we want a stop limit. What is the stop? What is the limit? Again we can read it here. The stop is 77.75 and the limit is 78. Okay. So if the price the next trading day is in this range, the order should be filled. Now what about the stop loss and the target? We go here. Remember, these two are good till cancel because if the order is triggered, these two should stay there until one is triggered. When one is triggered, the other one is cancelled. Let's have a look at the values. Stop loss is 74 44. Target 84 37. Remember, the target is the limit price and the stop loss is the stop price. If you're not confident with this, please review my previous video on order types. Okay. And then we check. We can check with this. Okay. Number of shares 30 is fine. Target 8437 good. Till cancel stop loss 7444 good. Till cancel is good. And finally the entry is stop price 77.75 good. Limit 7,808 good. Everything is good. We can send our order and then you can see the buy, the entry price, the stop loss and the limit where we have our target. That's all we can see if the order is triggered the next day. Again, remember, in this case we are near a resistance. Usually I will not take a trade, but because of what I explained you, because of this kind of ascending triangle pattern and the fact that the fundamentals are good and also the S and P is bullish, I'm willing to take this trade. One thing that you can do if you are less confident will be, for example, to risk less for this trade. Instead of risking one hour, you may risk half or 70%. That's another option. So with this video I wanted to show again how you can go through the process of having a trade, having a stock, analyzing if fundamentally is good, if the sector and the industry is good, if. If the technical the chart is good, and also how to place the trade for real. Again, thank you for watching. If you have any comments about the steps, please you can write me a comment below the video and I will be more than happy to reply. See you next time.










