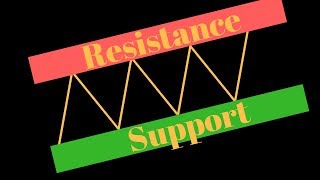
Alberto Costa shows how to draw trendlines by connecting price lows for support and highs for resistance. A valid trendline needs about three touches, works as a zone rather than a precise line, and shouldn't be forced if it doesn't fit clearly.
Chapters
Hi, welcome to this video on trend lines. As we have seen in a previous video, we can have horizontal support and resistance line. But that's not the only type of support and resistance. So today we are discussing the trend lines that are basically the same concept, but is not horizontal. Rather we have a slope. So let's look at this chart again, is the S and P. And you can see here that we have the price going up. Right? So let's zoom in on this area. Now again, as before, the idea of support is that we want to connect the low of the price and then is some kind of zone where the price is more likely to bounce. Bounce on. Right? So here we can go to the trend line. Trend line tool from Thingvis again. And maybe we can zoom here is even more clear. For example, what we can do. You see here it seems that those points are actually connected by some kind of line. So we may try to draw a line. This is not actually the best. So for example, here, You know, sometimes it's not easy to find a fitting line. And if you cannot find one, you should not force it. Okay, so if you can find a line that is connecting at least 3, 4 low is okay, like this one. And remember, is not actually a line, is more a zone. So we may say that is something like that. Right? So you see the price is hitting once, twice, three times and more and more. And the main idea is the same as the support before. When the price hits this level, it will more likely bounce up the other trend line. The resistance trend line is basically the same thing. So again, we can connect points here. Remember for the, for the resistance we have to connect the height. And again is this level here. Let me zoom in. Okay, maybe again it's not really something that we can clearly define. Is more like an area. So you see here we are hitting once, two times again here, again here and then here. And in this case we have a channel, okay, this is called channel where we have a support sloping up and then a resistance sloping up. The price is bouncing within these two ranges. And this is called channel up. We also have the channel down. That is basically the same thing when the price is in a downtrend. Like something like. Let me see, we don't have it here, but. Well, the idea is basically that you have the same situation that you see here, but with a downtrend. Okay, now again as before, how can we identify these trend lines? And again as before, we can use finviz. So let's have a look at finviz here and what we can do in terms of channel, we have this channel up signal here and you can. Oh, let's look at this. This seems nice pa. Yeah, this is a very nice example of channel up actually. Very strong support trend line. And maybe the resistance trend line is not as good. Maybe here we have something, but again if it's not really clear, don't force it. The main thing is that here you can see a very strong support. It's very clear, right? So when you have a situation like that is very good, but it's not so common. Anyway, with finviz we can find this channel up where we have a support trend line and, and our resistance trend line going up. We have the same thing when we are in a downtrend. So the channel down. Okay, so as you can see we have a situation where support and resistance trend line are going down. And then we can have a look at. Well you see again as before, if we have too many results we can add more conditions like for example the average volume or whatever you want depending on the strategies you are considering. But then another thing you can look for is this trendline resistance trend line support. So this is not a channel. We may have only the resistance or only the support, but this is something else that you can consider. Okay, so for example, here, Like here we have, here we are looking at the resistance. Here we have a resistance but the support is not so clear. Right? Or here for example we have a resistance trend line resistance and the support is the horizontal one. So it's not a channel but it may be a combination of a trendline resistance with something else. And then we have the trend line support. Yeah, so it's basically the same thing for the, for the support. Like here we have a support, here we have a support. So again as before you can leverage on finviz for identifying these trend lines. So you have the support and resistance here and then the channel up and down. And if you remember from the previous video, to identify horizontal levels we have this horizontal support resistance and then we have this channel. Okay? And again, remember that these levels are very subjective. So first they are not lying, they are rather zones. And second, as you have seen here, there is not a single way to draw them. Right? You may find it difficult to draw it and probably if it's difficult to draw it, it means that is not a good level. It should touch at least three points and you can have a look at the chart you find on finviz and then you can further look into the chart charts and see if the setup is good or not. So with that, I would like to conclude. Thank you again for watching and see you next time.