Understanding Japanese candlesticks in trading
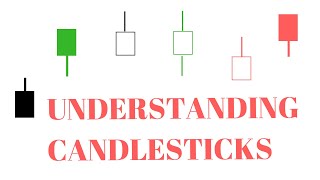
This content was created by Alberto Costa. This content was uploaded by Alberto Costa. This is a YouTube video titled "Understanding Japanese candlesticks in trading" created on March 11, 2019. The video provides an educational explanation of Japanese candlesticks, their configurations, and how to interpret them in trading charts, aiming to clarify common confusions and improve trading decisions.
Chapters
Welcome to this video. The topic today is the Japanese candlesticks. When you look at charts, usually you see this kind of symbols and they are very popular and they represent for every day. In this case, because I'm using Daily Charts 4, the Open, Close, low and high the day. Now what is the problem? The problem is that there are so many different configurations for these symbols that are called Japanese candlesticks that sometimes is very hard to understand. What is the meaning and it's possible to be confused. So in this video I want to review the main types of configuration that you can find. So let's go here and let's start by explaining what is the meaning of the candles. So in the chart I just show you, you have seen two type of candles. You have seen the green one. Okay, something like that. It was like that and there was also a red one. So what is the meaning of these two candlesticks? So these points, the low of the lower wick is the low price. Okay, this is the low price and similar here is the low price and this one is the high. And here same. The difference is on the body. Because when we have this green candle, this is the open and this is the close. When we have the green, the red one, this is the open and this is the close. So what does it mean if you see the green candle? It means that the price close above the open. In other words, this is a bullish candle. Here, the price closed below the open. So this is a bearish candle. Okay, so this is the most common setting. I would say it is the one that I use as well. Unfortunately is not the only one. That's why you may have some confusion when you see other settings. So what are other possible settings? Well, another one, let me move this here. Another one you can find the hollow. Fill setting. So the bullish candle in this case is something like that. Okay. And the bearish candle is something like that. So again, this is the bullish and this is the bearish. Now what is the difference here that we have one color and usually this color is black. Okay, so here we have two colors. Here we have one color. And to distinguish between the bullish and bearish, instead of having the colors, we have the fill or hollow. So the meaning is again the same. For the bullish candle, this is the open and this is the close. And for the bearish, this is the open and this is the close. Now to complicate things, sometimes you can find combination of this hollow fill and different colors. So now I want to show you two of the combination that you may find. Let's go here. The first one is when you have two colors, red and black. And also you have fill and hollow. So in other words, you may have four type of candles. You may have a candle like that. Then you may have a candle like that. And you can have the same in red, something like that and something like that. So now it may be a little confusing. What is the meaning of this? So again here we have the in the row and field, right? And here we have. Black and red. Okay, the meaning here is the following. The hollow candle are bullish. So this is bullish and this is bearish. Okay, the black candle. The meaning of a black candle is actually that the close of today is greater than the close of yesterday. And the red one is when the close of today is lower than the close yesterday. So that's the meaning of red and black. And you can also find another variant of these where you have green and red. So again you may have the green hollow, and then you may have the green field like that. And you can have red hollow and red field. And again the meaning is the same as here. So this is bullish, This is bearish, this is close, greater than close yesterday. And this is close below the close of yesterday. So why this can be confusing? Because suppose you are used to this setting here and then you see something like this. Now here you know that a green candle is bullish. But here what happens? You may have this candle, right? That here is bullish, but here actually is bearish. Okay, so this candle here and this candle here, they are not the same thing. One is bearish, one is bullish. That's why it can be confusing. Now I want to show you how you can set these different configurations with for example, tinkerswim, that is the platform I use, and also with tradingviews. So let's go to tinkorswim. Now here we have the setting with just green and red, as you can see. But if you want to use the setting with four types of like fill, hollow and green and red, you just go here you go to style and settings. And if you go to appearance, you can check here you see, this is the normal one. And by the way, dodgy that you see here is when open and close are basically the same. If I have candle, I have the two colors. But if I use the candle trend, now you have the setting with red, green, hollow and fill. So you may see here if I apply what happens now, you see, you have different the four combinations. And if I Go here again I want to check if there is a case where you have a change of color like this candle. Let me see. Cannot find an example. I wanted to show you basically the issue that I just mentioned that something here maybe, you know, maybe bullish in one, but actually is bearish in another one. Because again, remember that here only when we see the. Candles that are not filled hollow, that is a bullish candle. But when we see candles that are filled then is a bearish signal. Okay. And I can show you how to do that also with the tradingviews. Here, same thing, you just go here and instead of candle what you can do, you can go to hollow candles. See, very easy, you just change it here and that's all these other candles is more advanced so that the two setting that you should use is only the hollow here or this one. And usually I prefer this one because it's easier to understand. And you see that colors can change when you use one or the other. Like look at this candle here. Here is green, right? If now I go to hollow, now it's red. Why? Why is it red? It's red because of the comparison. Like the close of this candle is lower than the close of this. But it's a bullish candle because it's empty. Right? Is what I was saying before. So here is red, but it's bullish because it's empty. And if you move to this, you will see that it will be green. Yeah. So that's why when you use this setting and you have in your mind this idea that green means bullish and red means bearish. When you move to this one, you have to be careful because you may have green red candles that are actually bullish. So my suggestion is just use this or maybe the black and hollow with one color. But just use this because the other one may be confusing. Unless your strategy requires to understand and to be very clear about the close price compared to the previous one. But for visualization I suggest you to use a simple method like this that is also what I use here. And then I think it's good enough. So I hope that this help clarify the candlesticks because many times when you see videos or articles explaining that they are not so clear about all these different coffee configurations. And the problem is if you are taking decision and you are using wrong information, you may make mistakes. And you know in trading when you make mistakes, it can cost money. So I hope you liked the video. Thank you for watching and if you have any question, you can write me a comment below. The video and see you next time.










