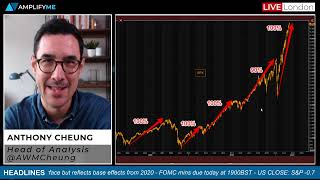
In this market briefing Anthony Cheung discusses a growing bearish outlook for US equities, focusing on the S&P 500’s technical picture and Morgan Stanley equity strategist Mike Wilson’s forecast of a drop to 4,000 – a roughly 10% correction. He outlines key support and resistance levels (4,432.5, 4,365.25, 4,250, 4,111.75, and 4,000) and explains how past market patterns suggest a rapid pull‑back after extended gains. The briefing then shifts to the New Zealand dollar’s volatility following the RBNZ’s decision to keep rates at 0.25% while signalling future hikes, compounded by a snap COVID‑19 lockdown. Cheung reviews recent Fed commentary, highlighting dovish non‑voter Neel Kashkari’s openness to tapering later this year and Boston Fed chief Eric Rosengren’s support for an autumn wind‑down, both tied to labour‑market data. He examines the UK CPI surprise (2% vs 2.5% expected), explains the base‑effect anomaly from the 2020 pandemic, and notes the pound’s muted reaction. Oil inventory figures are summarized, and the upcoming economic calendar (Eurozone HICP, US housing starts, DOE inventories, FOMC minutes) is outlined. Throughout, Cheung stresses the importance of looking beyond headline numbers, considering structural factors, and preparing for potential market moves.
Chapters
Okay, very good morning. Anthony here, going to talk to you a little bit about the US stock market, some statistics, and also some bank commentary of a more bearish disposition. And we'll talk about what the reason is behind that and how likely it is that it might materialize, and what does that look like on the charts. We're also going to talk a little bit about the RBNZ. We've seen some quite volatile price action in the Kiwi dollar overnight following their latest rate decision. Of course, this comes after they've gone on to complete lockdown following a very small outbreak of COVID-19, which has gone from 1 case to now 4 overnight. We're also going to talk about some Fed commentary, and we've even heard from one of the main doves, Kashkari, but talking more now about the timing of tapering, again confirming that not about if but when. And then we'll have a look at UK CPI. It's come out a lot lower than expected this morning at 2% versus expected 2.5%, and yet the pound has not moved, and I'll explain why. So this is your market briefing. It's Tuesday the 17th of August. Let's get straight into it. Before I begin, don't forget, if you're watching this on YouTube, don't forget to like and subscribe to the channel. I'd really appreciate it. But let's start with this. This is a look at the S&P 500, and someone had shared this on social media, but I thought it was quite fitting given what I've also heard out of the US Chief Equity Strategist Mike Wilson at Morgan Stanley earlier, earlier this week, who had a call on the S&P to move back down to 4,000. We'll have a look at the chart in a moment, but bearing in mind we're trading at 4,445 at the moment, so that's a significant and technical correction in markets if that was to materialize. But first off, we had, um, a continuous run of positive closes. Remember, we had seen the S&P 500 and Dow post the fifth 5th consecutive session of gains up till yesterday. And you remember in the briefing yesterday I was talking about whenever that happens, it almost always constitutes at some point in a snap of that and a fairly quick downward move. And I think we did see that to a moderate degree yesterday. And if I just look at this S&P chart here in a little bit more detail on the daily, you better see what I'm talking about. So this was that broader trend higher that we've been seeing over the course of the last couple of months, going back to really March of this year. And then we're in that really tight range to commence the month of August. You know, it's been particularly low volatility, volumes have decreased, quite typical seasonally of the summer period. And then we had a bit of a breakout on the downside of that very tight trading range. And so we blipped lower, but we have recovered. And we saw some decent buying off those initial lows. And in fact, the Asia-Pac session, we have seen, um, the Asian indices moderately higher, but we'll get to that in a moment. Going back to this chart though, statistically speaking, this goes back to 2002, and it was just looking at the general S&P price movement upon— of which was highly kind of talked about yesterday, um, the 100% gain from the trough of March 23rd, 2020, to where we printed at the recent all-time high, which is a 100% move. And what that tends to see— and, you know, history does have a pattern of repeating itself— and, and certainly when you get this type of movement, people start to ask these questions. And interestingly, it came as well amid a bit of press coverage around Morgan Stanley, and their US equity strategist Mike Wilson has a year-end price target for the S&P of 4,000, as I said. Additionally, between now and the end of the year, he also expects a correction even greater than 10%, stating the combination of lower than consensus earnings next year, lower valuation leads us to believe that there's very little upside, and if any, to major US equity indices over the next few quarters. However, on the positive side, he added that the correction would allow for the next leg of the economic expansion with the bull market to commence. Very important point there to understand short-term market movement against a long-term view on markets, because, you know, don't get me wrong, this chart has gone up. And so yes, the pullbacks here on 100% gain are very violent. Again, it's this idea, the analogy of the stairs up, the escalator down, but the destination is up. And so worth keeping that in mind depending on your time frame of investment. Um, in that respect. But let's just translate that to the charts and have a look at a couple of things and a couple of levels here that I would say are probably worth watching. So going off where we are at the moment from today's price, and one of the key areas I'd be looking at here in the short term that's more near to current price areas is this area here. So I'll draw a rectangle to make it easier to see. I think this area that we found some support both um, at the beginning of the week on Monday and also so far today. 4432.5 is quite a big level here on the daily chart for the S&P on the futures. I think any further breakdown of that, the next key level I'd be looking at is down here, 4365.25. Again, I'm not inferring that this would be intraday necessarily, but just key levels technically to watch. And then further down here at 42 42.52 and three-quarters. To give this some context as to what I've just discussed with MS, so from where we're trading at the moment, the range low to test down at those levels would only be a quarter percent move. A breakdown of that— and in fact yesterday's low was quite telling because as you can see from yesterday's low, that was also a relative point of interest now and will be again to the downside from these previous highs, that low that we had back on the 9th of August. And also yesterday responding to that level. So levels on the downside here, um, that would look realistic in any type of further extension on the move lower, potentially on the intraday, at 4111.75 would be around a less than 1% move. Down towards where we're trading late July would be around a 1.75% move. Down towards 4250 area, we're talking more now of a 4.5% type move. If we go to what MS were calling for 10%, well then we've got to go all the way down here to 4,000. And 4,000, you can see, sounds pretty dramatic, a 10% correction. But that does in fact just put us back to where we were basically trading at the prior all-time highs that were seen in March. So all in all, if you think about the pandemic journey that we've been on, that doesn't seem that unrealistic. And in fact, MS did say that it could even run even deeper than that. Before. And importantly, and I would agree, is the fact that even if this did materialize, you're going to get a whole ton of buyers come in and lift that market. And ultimately, I think the direction would still be higher, reminiscent of this graphic. So yeah, a couple things to think about there, uh, and to be aware of. Some interesting notes you can find on my, my Twitter handle if you want to have a look in a bit more detail of what I've just discussed. Um, but elsewhere, talking of the overnight session, quick look at the charts overall and general sentiment after that weaker handover on Wall Street where the major equity indices, the S&P and the Dow, were down about 0.7% and 0.8%, and NASDAQ down a touch lower or touch more, 0.9%. But Asia moderately higher, not really too much to speak of there, but snapping again a bit of a continuous losing streak. Japan, China, Hong Kong all posted gains overnight, and equity index futures seen marginally higher going into the European open this morning. Again, to keep in mind, although it was a lower close on Wall Street, we did see a decent bounce in the last couple of hours trade on Wall Street to narrow those losses overnight. We did have some really whippy price action in the Kiwi dollar, and this came after the central bank, which left rates unchanged at 0.25%, they signaled their intention to tighten policy later. They basically said that they projected a hike by year end and another 100 basis points of increases in 2022. So yeah, difficult for the market to handle because preparation was for a rate hike to be executed, but given the impromptu lockdown that's happened because of one case that's happened in the country, very aggressive reaction being taken by the authorities, and has basically delayed that from happening, but ultimately that they still see tightening before year end. So very whippy in the Kiwi dollar reaction overnight, obviously complicated by that snap national virus lockdown. The other thing to be aware of is a couple of Fed comments. Quite interestingly, a well-known dove but non-voter, Neel Kashkari, spoke overnight and said it could be reasonable to start reducing the Fed's bond buying program later this year, although that would depend on, you know what, the labor market. So in fitting what everyone else has said. And similarly then, what has come out of Fed's Rosengren, who's the head of the Boston Fed, again non-voter, he said he would support the central bank announcing next month that it could begin to wind down or taper on its bond buying this autumn and to get it on track to halt then by the middle of 2022. But once again, with inflation target pretty much met at this point in time, in terms of the emphasis on their policy-weighted decisions, it's certainly centered still on the jobs data. And again, that will continue to take precedence in terms of the, the actual definitive timing around tapering, both the announcement and the execution and duration of. This morning we've had UK CPI came in considerably weaker than expected. Analysts were actually anticipating it to remain, or to be a bit of a drop-off at 2.3% from the prior 2.5%, but actually undershot and came in at 2%. It appears weak on the surface, but if you actually look at the pound, the pound has seen close to no reaction at all. So again, for anyone observing markets or trading these markets, this is so key to be aware of, is not to just take it on face value. Do your preparation, do your research, and particularly in this pandemic period, because the headline CPI number people look at in the UK is the year-on-year figure, and apart— despite appearing weak on the surface, then it reflects largely base effects from the pandemic in 2020, which saw disruptions to usual calendar price reductions in closing and firmer petrol prices. So a bit more of a mechanical shift rather than an inflection point for inflation to now move lower. Instead, the expectation is, is that the August report, the next CPI report that comes out, is expected to return to the normal pickup and resume that upward trend as outlined through the, the forecasting of the Bank of England. So this isn't like the end of the inflationary pressures. PPI is still generally higher as well, so suggesting that there's still some inflationary pressures in the pipeline. So this is a one-time base effect anomaly because of what happened in 2020. So yeah, worth, worth always keeping that in mind, otherwise you could get caught short in a market that generally is unreactive for those aforementioned reasons. The other thing we've had overnight is the usual regular inventory data. The market hasn't really moved too much on this, so it's more of a reference point really for the DOE's we'll get later on this afternoon. The crude figure was a draw of 1.163 million, so a drawdown but not as deep as analysts were anticipating at 3.1. Cushing drew 1.735 million, gasoline drew 1.2 million, distillates a build of 502,000 barrels. .000. Quick look at the calendar then for the day ahead. So with the UK numbers out of the way, you get the HICP numbers from the eurozone for July at 10 AM, but these are final readings, so not expecting anything exciting there. So it pushes us further forward into the afternoon. US housing starts, building permits, DOE inventories at 3:30. Then you've got the FOMC minutes, of course, at 7 PM this evening. People will be looking at that definitely for any further details or insight, of course, around this idea about the timing around the withdrawal of the Fed support through its bond buying, so i.e., tapering. Fed Chair Powell in his July 28th statement said the Fed were looking for more progress in the labor market recovery before it would be prepared to begin easing on that $120 billion worth of monthly bond purchases. Since then though, we've had a lot of hawkish Fed commentary. None other than the Vice Chair Richard Clarida about 2 weeks ago commented about the timing of tapering and rate hikes in the future on this, on the, definitely on the more hawkish side. So be interested to see what has emerged from those discussions, but bear in mind they are somewhat dated. Given when that Fed meeting occurred a few weeks ago. And that is it. So again, if this is useful, if you're new to the channel, please don't forget to subscribe. Uh, lots more content not only coming from me, but plans for Eddie to do a lot of single stock analysis and other pieces as well. So, um, yeah, appreciate you being part of the community, and I'll see you same time tomorrow. Take care.