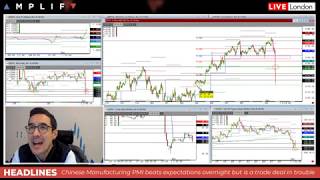
In this market commentary, the presenter recaps the latest US ISM Manufacturing PMI data, noting a miss on the headline index (within the lower end of the forecast range) and a significant miss in construction spending, which fell to -0.8% versus an expected +0.4%. New orders also declined to 47.2 from 49.1, and the employment component dropped to 46.6, a full point lower. These weak data points generate immediate downside pressure on US equities that were already vulnerable. The speaker links the data to broader market dynamics: the US dollar weakened after the releases, offering some support to equities, while oil has not yet reacted strongly but could act as a catalyst if it falls below key technical lows (e.g., the European morning low of $55.89). Technical analysis is provided for major indices – the S&P 500, Nasdaq, and Germany’s DAX – with specific support and resistance levels and projected targets. Gold is discussed, showing a brief bounce but facing resistance near recent highs. The commentary also references external catalysts such as a breakdown in trade dialogue and the pro‑democracy local elections in Hong Kong, which briefly lifted the S&P on a gap up. Overall, the video blends economic data, currency and commodity moves, and technical chart levels to explain the current bearish bias in US equity markets.
Chapters
So just to recap again a little bit of, of what's been going on. That ISM Manufacturing, a miss on the headline, albeit within the, the bottom end of the range. But the construction spending, quite a significant miss, -0.8. Expectations were for a positive 0.4. You've also got new orders down a decent amount, 47.2 against 49.1. The employment constituent, which obviously a lot of people will be looking at As for the, the kind of quality of the jobs report we'll get from the BLS on Friday, that also moved lower by over a full point to 46.6. So yeah, immediate downside pressure to a market that was already on the back foot. Uh, obviously the, the kind of breakdown in the dialogue on the trade front, the break of some of the technical range that was trading at the last couple of days of last week has just exerted more kind of momentum behind some of these moves. Just having a look elsewhere, oil hasn't really bitten as yet. You would normally in these types of correlations, if you're looking at a bad kind of setup here for the performance of manufacturing activity in the States, that would normally see oil move lower. The one thing is though, the dollar is getting, uh, has been quite badly hit on the back of those numbers, so just giving a bit of support, but I just keep an eye on oil. If it does start to be heavy, it could, it could act as an added catalyst to break some of the lower bound levels in the US equity markets. So just seeing oil now just starting to tick a little lower, $56 on the futures. Next stop, then you've got the European opening morning low in the futures at $55.89 as a target. And there you go, just a little bit more coming in. And there the NAS— there you go, the S&P now hits fresh session lows just as that oil was ticking lower. And so if that oil price breaks that European morning low, you might see a bit more follow-through in the equity move. Now the NASDAQ's right at that level on the lower bound as well, 8304. So that was the bottom end of the range on Monday and some of the subsequent highs seen on the Thursday and Friday of that week, 21st and 22nd. A break of there, again, you might start to see a bit of added movement, momentum go through. The DAX as well. The DAX now through that low on the 20th, and you can see how strong the selling momentum is there in the DAX. Next real target there in the DAX, you got the 13,000 level, and then you've got that rectangle there marked up on the left-hand side. You've got the high on the 28th and the beginning of November high wouldn't come in until 12,979. So Yeah, it looks like definitely we've got a bit of room to, to get down at that point because technically, well, you've got the 1300, which is really captures some of those support levels on the 4th, is your first test. Any break of that, I'll be looking down at those previous highs seen at late October, early November. Uh, just having a look elsewhere. Gold initially blipped up, came back, now it's starting to rise again, just running into a little bit of resistance for the moment at a high we printed on the 26th. That encapsulates some of the lows of the price action as well that we've had back in mid-November. It needs to really get its head above there if it's going to target up and around the high that we saw at the end of last week. Yeah, interesting there. You see the, you see the bounce in the S&P exactly on the opening price, to the tick of where we opened on Monday with the gap up on some of the positive trade developments and the pro-democracy local elections we had in Hong Kong. That was that gap up in the S&P. We literally tested it to the tick and just bounced about 4 points on the back of that. So that would have been your kind of maximum payoff of trying to get out of chasing that, that, that order flow coming in, hitting market on the momentum on that break of that range. And now the market's just pulling back quite severely.