FOMC LIVE session - 20th March 2019
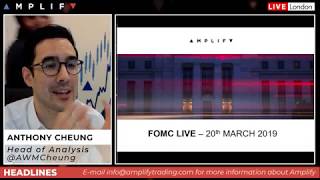
Anthony Cheung breaks down the March 2019 FOMC decision live as it happens. The Fed surprised markets by signaling no rate hikes for 2019 and slowing its balance-sheet runoff, sending bond yields down, the dollar weaker, and stocks higher.
Chapters
Okay, hello everyone, just testing out my microphone. We're not going to start the session until 5:30, so I'll leave the formal introductions until then. But as you can see, uh, FMC coming up, got about 45 minutes. I will turn the mic off for the moment other than doing a couple of sound checks and tests to make sure we can get going exactly at half past, because then we've got obviously 30 minutes until the main event. In the chat room though, you can probably see there is Sam North, who if you follow us on YouTube, you've probably seen him. He's that ruggedly good-looking handsome chap who, uh, talks about technicals and trade setups with me in the morning. So he's in the chat room as well. And then you've got Charlie as well, he's in there, who's commenting. There's a chat on the right-hand side So those guys are going to be here both trading the event and also keeping an eye on the chat to help out if anyone has any questions. So in the interim period, for anyone who does have questions, feel free to fire them in the chat room now. Those guys are more than happy to help. What we can do as well is that I'm going to deliver basically like a 20-minute preparation of how we're going to tackle this event. I'll then take on any few questions that we have just before the event. We'll have the squawk box on, which will have live the breaking news from our team of analysts that we have, that will squawk all the information when it comes out. And then I will come back on, review what's happening. I'll talk you through it in real time, that's the intention, and we'll pick through exactly, make sense of why the market's reacting like it has been. 6:30 then is the press conference. We'll follow that. I can give you preparation ahead of that event, and then at the end I can take on any other questions you might have. I can talk a little bit about Amplify, what we do in our training, and so on and so forth. We'll do that at the end of the session. So that's the plan. So for the people who've logged in, thank you very much for joining us. Again, just to be clear, we're going to start the session at half past 5, so in 10 minutes' time. So at the moment, again, we're just testing out the feed. Thank you for everyone so far that's logged in. So Roland, Oliver, Ellie, PAFX, I know you're in Australia, so thank you for joining us. JN, again, yeah, we're going to give it another 10 minutes and then we'll get cracking. I've got a series of slides that I've prepared for you guys to make things as kind of taking quite a complicated event, trying to make it as simple as possible. Any questions, as I said, feel free to message Charlie, myself, and Sam. We're all here in the chat room now if you need anything. Okay, just before we start this, uh, FOMC event, while we're waiting for everyone to get online before we really get cracking. Let's have a look at the charts. Let's have a quick chat about what's been going on today because we've had quite an interesting afternoon actually. For any of those who are new to joining us, let me just explain the chart formation. You've got EURUSD top left, followed by Cable center top, Gold futures— these are all futures markets— uh, Gold top right. You've got the Dow, NASDAQ and the S&P in the center. And they've got WTI crude futures and the US 10-year, the T-note future, in the bottom. Now, interesting what's been happening today. Let me just go through a couple of the highlights that we've been watching in markets today. One is the DAX, been a very interesting move here. This is the session today as it's unfolded, really, from yesterday. So we opened this morning, uh, let me just get it the right candle. So we have seen a decline of a fairly sizable margin throughout the session today. So really this move here now— well, actually, this is the— let me just get my charts in line and in order. So this was the 5-minute. I had it marked up in preparation. So this is the DAX today. Now, as you can see, we gapped lower. This, again, for anyone who's new to markets, this is what we would classify as a gap down. That meaning then that at the market close on Eurex, which the DAX future trades on, that's when the market closed. So it's 9 PM London time. Markets reopen then just after midnight now in the DAX future. But you can see in that interim period, the market gapped lower and then traded lower in the early part of the Asia-Pacific session, and then went sideways, consolidated, making a kind of footprint, if you like, of a technical support point which got breached retested and acted as kind of a level, then turned resistance for a move lower today. Now, why did it gap low and what was the wait overnight? Well, one of the main things that you had, if you're an equity trader, there's a necessity— you need to know the constituents that comprise of your index. And in this case, in the DAX, the German stock index, Bayer is one of the largest companies, pharmaceutical company, and they came out and they basically had very negative news about a case ongoing about someone who died through cancer that potentially came from one of the products in which they make. Very big news for the firm. To give you an idea, their market weighting is about, I think, 8.3% of the DAX entire index of 30 companies. So that one company comprises of nearly 10% of the entire index, and they were down about 10% at market open this morning. That then followed with here, as you can see, You've had BMW, they issued a profit warning. You can see how quickly the market reacts to these fundamental kind of catalysts. And then you can see, as I've highlighted here with the ellipse, how the market responds technically in these what we would call speculative fast money moves to the various points where people look to book profit in these short-term news-inspired or news-driven events. BMW profit warning, well, that's pretty telling for the automotive sector in Germany. And in terms of the sectors that make up the DAX index, the automotive one— if you think of VW, BMW, and Daimler, that's then proportionately the largest representation in terms of a sector within that index. So VW came out, and you can see here then, once the market has reacted to BMW, the move is way more violent here comparative to here. Even though it still does tick lower at the, the following few minutes and then the minutes thereafter. A lot of this is to do with the repositioning of the market. If one company within a fairly small, quite controlled monopoly of firms has issued a profit warning, it's really not too much of a surprise if others are following suit. But what you can see here is fundamentals and technicals working in combination with one another quite well. So keeping on top of the news, pivotal. Having a squawk to do that, absolutely essential, which we'll talk about later. This slightly longer time frame of the DAX, very important. Then I wouldn't typically look at a 5-minute chart. This is just for explaining to you the news with the price movement. Typically looking at longer time frames, by that I mean 30 minutes, 60 minutes, to get a bit of a better feel technically where the levels carry a little bit more validity in that sense. So that was the, that was the DAX story. That's been quite interesting today. Um, just while we're waiting for half past again, we'll get— we'll kick off with the, um, FOMC. Just while we're waiting till then, uh, oil's been very interesting. Uh, we just had some incredibly bullish infantry data that comes out from the Department of Energy every Wednesday afternoon. It showed a sizable drawdown in the amount of oil, which then is a bullish signal Prices spiked higher. There was drawdowns in the other components like cushioning and gasoline. Basically, stockpiles are drawing down, less supply, equal demand, net-net price goes up, breached through that previous daily high. And on a daily continuation chart, you can see here, this is looking at the last year of price action in WTI crude futures. And obviously, this is the dramatic repricing of about 45% we had from the October peak to the December low. And these are kind of, again, when some of these basic technical tools and indicators in markets get looked at quite closely. When there's such a defined high and low, and obviously a fib retracement study is quite an effective tool in these conditions. That level we're trading at the moment was the 50% fib, which you can see if we zoom in, the market has been responding to at the moment. And then obviously you've got the psychological 60 handle and then some of the previous areas of support here. So quite interesting here. Obviously, global growth concerns have kind of stabilized over this period. The Fed have, of course, turned very dovish, which we're going to talk a lot about in a second. And then you've got the commitment from particularly Saudi Arabia, the kind of de facto head of OPEC, who continue to push on with cuts, and that's helping keep these prices on the front foot, as well as progression on the trade talks, of course, which are pivotal for the demand side of that equation. All right, I'm not going to look at any other charts other than a final word about Brexit. Loads of Brexit headlines today. You can see there's been quite a significant dip in the price of cable that's happened over breaking out really at the bottom end of this range that we've been in the last couple of sessions. There's been rumors swirling of Theresa May's resignation, but I would treat those with a large pinch of salt. I don't really give them much validity at all. This has all come on the back of the fact that she had been penciled in to meet with Tory backbenchers who formed the 1922 Committee. These are typically Eurosceptics, which have been pushing for for a short extension. She's meeting them at 5:00. She's said to be meeting opposition leaders at 6:15 this evening. So it could be amid all the FOMC noise, we actually get an update on Brexit as well. There hasn't been any firm commitment from Number 10 yet, though, about whether or not there is going to be a press conference. So quite a fluid situation and one we're monitoring tonight as you're with us. Okay. So just have a quick drink, uh, non-alcoholic of course, and then we'll crack on. As I've said, Sam is available in the chat room, Charlie's there. I'm going to open up with a bit of a 20-minute assessment of what exactly is it that we're looking at to make sense of the information that's going to come out in half an hour. Any questions as I go, please feel free to to just put your questions in the chat room. Okay, well, let's get this show on the road. First of all, I guess, thank you very much for joining us and giving up part of your evening. Hopefully the Fed are not going to let us down and it's going to be an interesting event. What my intention is, is going to go through a series of slides I've prepared where ultimately a central bank policy announcement like this, whether it be the Fed, the ECB in particular, the Bank of England, typically they are quite complicated events to trade. They're highly volatile. It's something which requires quite an in-depth understanding of monetary policy as well as being able to manage risk in high volatility, which generally comes with a lot of experience. But what my job is to do is try to at least get you in the right direction, and what I mean by that is breaking down something quite complicated into something more manageable and a little bit more actionable when it comes to a trading situation like this. So let's get going and let's have a look at some of these slides and and what we're looking at. First things first, order of play, very important for any of those not familiar with the process of a Federal Reserve, um, interest rate announcement. There are 8 per year, of which typically 4 are particularly important. Now, those 4, easy to remember: March, June, Sep, Dec, fall on the calendar quarters. The difference being with those ones Well, the only difference really is we get something called the Summary of Economic Projections, otherwise known informally as the SEP. And as we're going to discuss, this is very critical for tonight's announcement. I'll get into more detail shortly. So of the order of play, two parts. You've got 6 PM, we're going to get the interest rate announcement, we're going to get the statement which I'll show you a copy of the last one so you understand what we're looking at. And then we get the summary of economic projections. Part 2, we then get the press conference. So this is when the Fed Chair Jerome Powell will take the stand. He will then start delivering an opening statement and then go into a formal Q&A with the press in attendance. And typically this goes on for about an hour, but there is a clear hierarchy of the press. And it will be the most influential— Wall Street Journal, the FT, and so on. And we'll look at some of the key questions potentially that he could be asked, and importantly, that could be market moving. So this is the statement. This is what a Federal Reserve actual statement looks like. Now, if you are not familiar with this, this might look like absolute, you know, gobbledygook. How do you make sense of this? Quite technical language. However, I think a couple of points to be really clear about. A central bank goes to great pains to make very subtle, very gradual changes to their language. Remember, their overall objective here is to move policy in the most coordinated and orderly fashion to avert market volatility as possible. If you think about it, it's the opposite strategy of US President Donald Trump, who wants maximum splash every time he speaks. The Fed, opposite. Same for every central bank. They're in the job of stability, not volatility. What I've tried to do here is break the Fed statement into 3 distinct parts. So part 1, which is paragraph 1 is the description of economic conditions. What have they termed specifically for the job market, economic activity, household spending, and importantly inflation? Now, as you can see here, they have very distinct words that they use to describe these situations. Now, as you get more familiar with any language, you'll find that the central banks tend tend to use what we kind of call in the market as code words. And code words being suggestive then of, are they becoming more optimistic, more pessimistic, more bullish, more bearish on certain situations? For example, with inflation, if inflation has been deteriorating in the US, well, do they alter the statement specifically that talks about inflation, which then could be a telling sign of coming across as slightly more dovish in the way that they're communicating. Dovish being then lower yields, weaker dollar would be a traditional kind of response. The second paragraph is the decision on interest rates. I would say this is probably the most binary of all the paragraphs. This is just then the actual decision. And then the third paragraph, associated conditions with future decision-making. Now that's very key because what we're trying to ascertain there is, well, what could be the future course of action? And what is that exactly that they're pinning that on. Now this is what the actual statement looks like in reality when we're monitoring, analyzing, trading these events. This is when we rely on a Bloomberg, a Reuters terminal, or like we have Amplifiers, a fully manned squawk desk, and then they verbally release the news as it comes out. They don't read the whole statement. They will pick out isolated one lines that describe the most important areas, and then we react accordingly. Okay, let's have a look then at economic conditions in the US. And so this is the US economy. This looks at the last 6 years to give you a bit of a feel for what we've had. And in particular, I want you to focus on the far right. and this is the peak that we had of 4%. And if you look at the bottom axis, you can see here the associated time frame of what this is representing. You can see the highest bar that we've had for many years came immediately after the corporate tax cuts were deployed in America. This was when equity markets were trading at all-time high valuations. Things were looking very encouraging at that point. However, by an economy heating up, by default leads then to greater risks of the Fed in particular quickening the pace of policy tightening. And that is a worry for financial markets, which have been propped up for almost a decade by very stimulative, accommodative monetary policy. Not only that, if you think about what really has defined 2018 and what's been the rule at the heart of a lot of the, uh, associated risks of an economic slowdown has been emanating from an ongoing and escalation in trade war between the US and China. And that reverberates across global kind of perception about what the future holds. So with that, the economy has started to slow, and it's been very telling. Now, this is something which some of you might, might not be aware of. This is something called the Atlanta Fed. So again, for any of those new to markets, let me be clear to give you a framework. Basically, the U.S. Federal Reserve meet 8 times a year, but within the U.S. there are 12 what we call regional or reserve districts. Each one of those then is kind of like if you're in the UK, if you had a head of county So like the county of Sussex, the county of Kent, Yorkshire, and so on. And so if you were monitoring an individual unique area, for instance, like in the UK, the workforce and the productivity of the southeast of England is very different to the northeast of England, which is much more manufacturing, industrial compared to financial services, inclusive of London in the southeast. So better to have granular level information information to make an overall national decision. The US, exactly the same. So they have regional banks. Now, one of those is called the Atlanta Fed. Now, of the Atlanta Fed, they have something quite unique of which institutional traders follow and economists and analysts look at, and it's called the GDPNow model. Now, just to keep things absolutely as simple as possible, because otherwise it does get quite complicated, um, The Atlanta Fed GDPNow model basically mimics something called the BEA estimate. Now the BEA estimate is key for traders and market participants because that's the Bureau of Economic Analysis. They're the people or the body that compile the statistical data for GDP in the US from a government level, but that only comes out every once a month. So we get this kind of in the dark, if you like, and then we have a piece of information, then we're in the dark again until the next release comes out. What the Atlanta Fed model does is it updates after every major piece of economic data in the US comes out. So it gives us a rolling expectation of what we think GDP will be in the future based on a model that replicates that of the government. So should be highly accurate. So again, remember, Today's market prices are moving on future expectations. Now, as you can see here, this is where the range of blue chip consensus is, and this is where the GDPNow model is— way down at the bottom. Actually, we're looking at growth of 0.4% is what the GDP model Atlanta Fed is suggesting. So just go back, remember we're at 2.6% at the moment. Things like a government shutdown The weighing effect of the— what it's meant for sentiment of the ongoing trade war, lots of other factors have meant that the economy is slowing for sure in the US. And this is obviously problematic for Trump, given he wants to start thinking politically for 2020 ahead. So what does he do? Does he want to get the trade deal over the line now because he wants to have a strong economy? Because a strong economy is good for popularity from an administrative point of view. All right, so that's all talking quite bearish about the market, but we're not talking about the collapse, the end of the world, and the Fed are going to come out and bail everyone out. It's nowhere near that. We're talking about interest rate rises, don't forget. And you would only raise an interest rate if you were fairly confident that economic conditions warranted tightening. So what this is here, this is a table, and let me just explain what we've got. So this column here or this column here to start. These are all the major tier 1 economic data points that come out of the US on a rolling monthly basis. This is the last print that we've seen, and this was the data as it stood when the Fed last met and held a meeting on the 30th of January. Here, quite simply, the green suggests then the data has improved, the red the data has got worse. So on the balance, you can see it's fairly even between green and red, meaning, well, everyone's thinking the Fed are going to be dovish, but actually on a granular level, looking at every piece of economic data, why do they need to become uber dovish? The economy actually is not that bad. And if anything, I would say is stabilized. There was a run of downside economic surprises, but things have stabilized and recovered since. Let's not forget that the equity market in the US has had one of its strongest rallies after the collapse at the end of last year. The rally that's ensued from the beginning of January is one of— been one of the best rallies in the last 30 years. And things like, um, consumer confidence is back up, retail sales have bounced, pending home sales are picking up. So hence the reason why this is a little bit more balanced than thinking it's like all doom and gloom. This is one of the key things you need to be aware of to manage this situation. This is how a market's priced. Let me just explain what we're looking at here. The pink line at the top— so this chart, you can divide it into half, two halves. Top half, this is market's expectation derived from something called short-term interest rate futures, or the federal funds rate. From this, we can calculate what percentage probability markets are pricing in fixed income for a 25 basis point rate hike today from the Fed. And what the pink line shows you is that this is markets' probability of no change in interest rates, which they're assigning— this is markets pricing— 98% chance that nothing happens today on interest rates. To be clear, We're not— we don't care about that. What we care about is the future. What do they do with rate hikes in the future? Now here's where it gets a bit more interesting. The bottom half of this chart is then showing you the, the kind of light blue line, and that is the likelihood that we have a rate cut in the US. So how about that? We're not talking hikes now, we're talking rate cuts. Remember, the Fed, as per communication as of today are talking about 2 rate hikes. The market is pricing a 27% probability of a rate cut at the end of the year. Complete opposite. All right, so that's markets positioning and expectations. One thing you're going to hear a lot of coming up, and I'll try and whip through these slides as quickly as possible so we've got plenty of time for the release, uh, is something called the Fed's balance sheet. So again, let me keep this as simple as possible. There's 2 forms of major policy tools the Fed use. Tool number 1 is often referred to as traditional or blunt instrument, and that is interest rates. In normal economic times, interest rates go up and down in order to manage an economy. In unprecedented times like a global financial crisis triggered by a collapse in the housing market and a global recession, well then, once you put interest rates to zero What else do you do to stimulate an economy that's on the precipice of a collapse? Well, that's when you start doing unconventional measures, things like quantitative easing. So the Fed's balance sheet is a reflection of QE, what they've done. So remember, Lehman Brothers collapsed in September 2008. So this is this era here. This is when the balance sheet, the Fed, was just over $800 billion. But as I said, they slashed interest rates to zero, but to add additional support to the market, they started QE. Now, they then did QE not just once, but twice and three times, ending it in 2014. But through that period, they bought a phenomenally large amount of bonds and a variety of bonds. They bought normal notes and bonds, so things like Treasuries, for example. They bought mortgage-backed securities, or MBS, and and they brought other bonds, things like corporate bonds, for example, but most of these being Treasuries and MBS. Now, this is from the financial crisis to 2014, and that's where they paused then on active QE. That takes us to where we are today. So this picks up, uh, the mantle from 2014, takes us right up to the current day. So what the Fed were doing with the balance sheet is once it hit $4.5 trillion, the economy, if you think about it, was several Years on from the financial crisis, the economy started to improve, and then came 2015. Interest rates, for the first time in several years, started— for the first time— to start going up. And that's the beginning of the sequence of policy tightening, or what's often referred to as normalization. So this is taking then this unprecedented era of super-accommodative policy, and now the economy's back on its feet, we need to now normalize so we've got options for any future downturn that might materialize and to manage the economy accordingly. What happened there was they continued to roll over the existing QE in the system up until the beginning of 2018, when they've then started something called quantitative tightening, QT, the opposite of QE, where any bonds that are expiring, instead of reinvesting the principal and buying back the same bond, for example. What they've been doing is not reinvesting, i.e., subtracting out some of the QE out of the system in a very graduated way as a follow-through of raising rates, also taking QE out the system— a dual-fold mechanism of getting the economy back and policy back to normal. Now, that brings about then a key point. Because if people are super panicked about tightening, well, this isn't just about interest rates, this is also about the balance sheet. So the conventional and unconventional measures. Now with the balance sheet, the reason why people are talking about this specifically now is that in the January Fed minutes, the Fed were very explicit where they said that they're to announce before too long a plan to stop reducing asset holdings later this year. Hence the reason why we're looking for it now, March. March being key because it's the projections and the press conference to follow. Easiest way for me to break this down is in a 3-point structure, as when the news comes out. So do they specify an end date, i.e., when are they going to end this process of letting the balance sheet unwind or the runoff? So do they specify a specific date like October, for example, Basically, we can take the trend and ascertain from there the fact that the balance sheet will probably stop then at $3.75 billion. The quicker they stop this, the more dovish the implication for markets because they're halting tightening. The longer they let it run, the more hawkish it becomes, if that makes sense. The second thing is, do they aim for an actual balance sheet size? So instead of looking at duration, they might look at nominal value. And say, actually, when it gets to $3.5 trillion, whenever that might be on the calendar, we will stop. So that could be two forms, the way that they could do that. Again, the higher the amount that they stop, the more dovish. The lower the amount, the more willing they are to let the balance sheet unwind, the more hawkish. That is the third point, would be, do they discuss the portfolio of assets on their balance sheet? By this I mean, here they hold lots of different types of bonds. Some of the word from economists has been the belief that they would like to only hold nominal notes and bonds, not the other stuff. So do they clarify that point? Could be interesting. Okay, a couple of other slides, uh, and then I'll come off the mic and we'll tune in to the actual event. This is the generic government 2-year yield in the US, and really this is just to show you how expectations have changed. And obviously with the equity market sell-off that we had the end of last year, people's expectations about rates in future had to be realigned and come down. And then this leads us on then to what we're looking for from the dot plots. Now, dot plots are something which only come out in every quarterly meeting from the Fed. They are the key thing of which the market will be looking at. Remember, no one is expecting a rate change today. That is redundant. The probability of that is so small it's not even worth considering because it's a calculated risk that we're willing to take, i.e., it's only 2%. What the market is concerned about is this, and each one of these dots— let me just explain— is a member of the Federal Reserve. And so each meeting on every quarter, what they do is they ask each member of where do they think interest rates will will be at the end of each subsequent year. From that point, we are able to derive a median dot plot, it's referred to, and that's the green line connecting the medians to each year, which gives us a trajectory of interest rates over time. Now, what we're expecting is, given the economic conditions have changed, that this green line is going to become much more shallow, indicative then that since December— remember, we're 3 months down the line— that this has to change. And the question is, the more shallow, the more dovish. The more unchanged, the more hawkish. If you wanted to know who the dot plots were, this is a graphic from the research team at Bank of America. This assigns them an FOMC member. So this is when it brings in some of that terminology about who's the most dovish, who's the most hawkish. So if you think about it, someone like James Bullard, for example, of St. Louis Fed, he wants absolutely no change in interest rates basically ever, whereas his absolute counter is Esther George, who wants multiple interest rate hikes, almost doubling the rate of interest in the US by 2021. So this being hawkish, this being dovish. This is what I think could be a big surprise for markets coming up. And this is the median line again that we've just looked at. But this green line here at the bottom is indicative of the latest Fed Fund futures pricing. So this is the markets then overlaying some of those previous graphics. This is quite simply the markets are expecting very dovish outlook here from the Fed. However, that's why I think even though the Fed might be pessimistic, and yes, they will cut the amount of hikes that they're going to do in future, but the market is so overtly extended in a dovish position that by default then it might create a kind of hawkish reaction by a function of how the markets are positioned. What are the big banks saying? Well, let's just forget Goldman Sachs, Citigroup, because let's face it, they don't matter. What matters is Amplify, of course. And, um, sat— spoke with Sam earlier today, put our heads together, and we put what we thought would happen today. So we think they're going to change the 2019 dot plots from 2 to 1 because we think they want to keep the optionality open about then going from 1 to 0 in the future should economic conditions warrant it. We also think they're going to downgrade growth and inflation how far and how aggressive they do so will again be a defining factor of how hawkish or dovish the whole event will be perceived in part 1 at 6 o'clock. We think though that with the balance sheet guidance, they're going to be fairly vague, suggesting then that there's no explicit end date or nominal size. I would say though that Goldman's have penciled in that they think they, they the Fed are going to suggest they're going to conclude this in Q3 or Q4 as a timeline. Questions from the Q&A, keeping this really nice and simple. I think the main things for the Q&A you've got to look out for: details on the balance sheet unwinding, impact of the ongoing trade war between the US and China, how much of a consideration is that for Federal Reserve members, further assessment of recent global and economic slowdown, and particularly then external headwinds, things like Brexit. Remember, the EU referendum was a massive factor in the Fed's decision-making as to not hike in 2016 when they only did one when they said they were going to do four. So the fact that Brexit is unresolved and we're coming close to D-Day, how much of that is a factor for their forward-looking considerations? European slowdown, other things to factor in, fluctuations in oil price and so on. And then of course our main man Donald Trump, big uncertainty factor as ever from a fiscal implication, foreign policy, his criticisms of the Fed. You know, how much of that have the— does Jerome Powell and his colleagues need to factor in? Last slide and then we'll, uh, we'll await the actual event in itself. This is my checklist then of everything we've just covered. 2 parts to the event. Part 1, just to be clear, is going to be highly volatile. If you were new to trading and you weren't— you haven't gone through something like the Amplify training program, or you haven't spent many years just going through and really honing your craft, I would not even consider trading an event like this given its complexity, given the high volatility. You cannot just chase prices in an event like this. You will fail and you will lose money. What you do need to do is do a lot of thorough preparation, think about everything and all your game plan and strategies ahead of time, so then it becomes a case of execution rather than an emotional reaction. That definitely helps cut through the noise of information, but also anticipate then your execution of a trade, its structure, its risk management, its trade execution from an entry-exit point of view. So it's all stuff that we would do, our traders at Amplify. We've been kind of prepping this up all day for an event like this. So ignore the, the main change of rates. Attention is going to be on the number of rate hikes, the dot plots, the severity of the downgrade on growth and inflation, the details around the balance sheet. Part 2 is then the Q&A, and then that's when we're going to be a little bit more fluid, reacting to as and when the chairman says something. All right, that is it from my side. Over to you guys. I will put the squawk on, I will play it through the channel, so you're going to hear those guys call out the news. Uh, just to recap what I've got on my screens at the moment, I have Basically EURUSD top left, followed by cable futures, gold on the right, top right. In the center, I'll change this back so we've got the Dow so we can see everything. You've got the Dow on the left, futures, NASDAQ, S&P, then you've got WTI crude and T-notes on the bottom right. Okay, you've got about 3 minutes now to the event. Obviously any questions that you guys have got, I can address them after this initial announcement. So what I'll do, let's cover the announcement, let's hear it come out, let's watch it happen. I will guide you through my interpretation of what it is that's happening, and then I'll look to take some questions shortly after. Okay. Okay, we've got about 90 seconds. Just to keep you informed, I'll have my squawk on, you'll hear it come out, so I'll stay silent while the news comes out. Sam is going to post the main headlines into the chat room so you can see them as well in text form.
Have around 1 minute now until we get this FOMC rate decision. We will of course take be dispatched with the decision, be forecasting the statement, and we'll then recap on the main points of that afterwards.
So just a reminder, it does get very volatile. You'll see jumpy price movement the next couple of seconds. This is just illiquid. People pull their orders.
10 seconds.
5 seconds now.
That's unchanged as expected. Looking at the trajectory of rate hikes, it looks like they've cut the 1 for 2019 now to 1 hike.
Sees halting balance sheet end of September. So sees halting balance sheet end of September. I'd say that's way earlier than markets were expecting. Immediate upside in T-notes and stocks. Dollar getting smacked on the back of that. Euro-dollar session highs. Looks like to me the Fed taper balance sheet roll-off, and they see it halting end of September. The Fed signals no rate hike this year, one increase in 2020. So again, the Fed signals no rate hike this year and one increase in 2020. So on the surface, very dovish here.
An initial interpretation: the long-run forecast for GDP 1.9%, unchanged. Jobless rate for 2019 4.3%, down from 4.4%. PCE at 2%, unchanged. The Fed says it intends balance sheet runoff to slow beginning in May and end in September, provided that economy and money market conditions evolve as expected. Repeat, Fed intends balance sheet runoff to slow beginning in May and end in September, provided economy and money market conditions evolve as expected. It's going to be reducing the cap on monthly redemptions from $30 billion to $15 billion, and it plans to reinvest payments on agency and MBS debt into Treasuries beginning October, max $20 billion per month. It says it also plans to provide more details on market operations in the May meeting. So it's expected any balance sheet amount from what I can see. Once again, we are going through the details.
Yeah, this is a big dovish surprise, guys. Just to start with. I mean, T-notes just absolutely exploding on the upside at the back of that. Dollar getting hit, equities rallying. Again, no rate hike this year. They intend to slow the balance sheet runoff in May, ending in September, provided economy and market conditions evolve as expected. So yeah, this is a lot more giving to the market, if you like, in that they're willing to support by being very gradual with the, the roll-off, i.e., the tightening policy. Also, remember, we were just talking about— and they were going to go from 2 to 1, they're going to none. That certainly is quite a big step in the dovish direction. So irrespective of the dovish pricing of markets, certainly this is a much bigger surprise. Nearly every bank on Wall Street was expecting that zero to be one. Hence the reaction that you're seeing. Yeah, let's have a look. S&P rallying upside target. Sam, what are you thinking? Got pivot upside, high of the day is coming in. A pivot earlier was the European morning high. You've got that here marked up on my chart. You can see 2841.75, that would be initial target maybe for exit. You've got the also prevailing high that came in here. Let me mark this up so you can see it. You've got that high print that we've seen midday, that lines up here. You can see these previous levels. So first port of target here on any fast money, money move, you've got 39.25 upside. Just hit that now. You can see market probably just booking a little bit of profit on that initial run-up. Any breach of this will probably open the door to 42, I would suggest. Just keep you informed. I'm just going through the Federal Reserve website at the moment. I'm going to go through the dot plots myself, see if there's anything else I can get out of it. To give you any further insight. But at the moment, obviously, I think this has just been a clear dovish surprise. As Sam was telling me earlier, is he got— has Trump got Powell in the pocket? Bold statement, but this is obviously quite a big step in the dovish direction, which was against market expectations, hence the reaction that you've just seen. Anything in the euro, Sam, you're looking at? We're coming up to 115 now in the futures. What type of timeframe you looking? Okay, Sam said he's looking at a 240 timeframe here. So if I look at 115, the reason why he's saying that, I can see here you got that area of basically the lot in end of February highs. Let me put a rectangle around that price action coming in around here. So you've got the handle test at the moment, and then you've got the top side of the price action of the last, what, 6 weeks. So we've already broken that longer trendline, but yeah, further upside. Pivot test in S&P. So as we were just saying, and a further extension as markets digest this dovish release. So gone through that 39 and $1.25 level. As we were saying, initial target at pivot, hit that, and just again a little bit of profit taking, fast money move, just booking profit on those, those longs. And normally what happens here is you get quite a decent amount of price action, particularly given how surprising this outcome is. Things will probably start to die down in about 10 minutes' time. People will then lock into the press conference. Again, that begins in 24 minutes' time. NASDAQ still moving higher for the moment, fresh session highs. And of course, with the dollar getting hit aggressively on the back of this, gold has punched through, reversed all of the losses seen earlier in the session, and gold now is back above, uh, the high that was seen on the 13th in the futures at 11.6. Let me just put this on a daily. What levels have we got here? This is zooming out the chart on a daily continuation, uh, so you can see fairly significant level, uh, we've just gone through. Let me just tidy this up. That previous high point just broken above there. Now, uh, probably be looking upside first targets at around this level, and then so 16 and 21. Bit of a big call to get up there. We've already rallied aggressively, I'd say. A lot might ride on the press conference and what he follows it up with. Uh, Dow still some way short of the pivot. Uh, quite interesting looking at the, the three majors. The NASDAQ's well above its pivot and it's at R1. However, the Dow and S&P are still sub and finding some resistance. You can see there, very similar setup. I wouldn't anticipate the Dow and S&P to break higher, not unless both of those indices simultaneously break that level. We've obviously got the 2600 handle just above in the Dow future, so maybe that will cap the upside on any rally for the moment, at least until the presser is— comes through. Okay, so just while we're— the markets are kind of— this is what you typically see markets start to die down a little bit now. You get the initial euphoric kind of response. A lot of fast money moves. And now people will kind of sit tight, wait for the press conference to begin. So let me just walk through a couple of things. This is actually what the Summary of Economic Projections looks like. Now, for those who are new to markets, you might not— never have seen this. So when we talk about no rate hikes in 2019 and, and that shape of the dot plots on those charts I was showing you earlier, this is actually what what the table of data looks like. The only thing that happens is from this— so what, what the projections we get for GDP, unemployment, PC inflation, core PCE. But the important one, obviously, from a quickfire market reaction point of view is the federal funds rate. What you have here is the top line. So this line is what federal funds rates are foreseen to be at the end of the year, and then what the previous projections were, as to then see where rates should be at that point in time. Um, looking then further down, you get the actual dot plot. So this is what it looks like, and as you can see, I'd say from the composition of this, there's been quite a distinct, uh, uniform move almost. It's very unusual to see quite clustered together Fed members. This means that actually what's happened is there used to be quite a divergence between hawkish and dovish perspectives of what the best course of action should be. What this is suggesting is maybe there's a little bit more harmony amongst them about, well, actually I think it's the right course of action to become very dovish. This would, to me, the shape of these and the lack of, uh, width between the most extreme outliers becoming more clustered is dovish in my mind. The other thing, the question is here, and a great one Eddie was just asking me, was why have the Fed— what are the Fed not telling us here? What are they panicking about? Why are they going to such great depths to go so dovish? Is there something they're worried about? Is there something they're not telling us? So this is what's going to be key for if we get a secondary phased move out of this market on the press conference. Interestingly, the market's just taken another bid in the equity space on the back of what's been happening. The S&P is back on testing that level, uh, right now. And euro still hasn't quite got there. Gold though accelerating on the upside. Let's go back and look at that gold chart, a slightly bigger time frame. Yeah, so just busting through that high print that we had back on the 13th of March. That was the kind of monthly high, exiting out the 1st of March. And so just taking a run-up probably be looking at there, 16 in the futures, uh, this area here. If I was looking at a target that's most clearly outlined from a technical perspective. But yeah, it's a good question. Would we hear quite large degree of pessimism about the global risks that have pushed the Fed into this very dovish surprise? If that is the case, we could get a continuation. So probably prudent now to start marking up the charts if that were to be the case. On the flip side, the other thing that I'll be quite keen on watching was that this balance sheet runoff in May ending in September was contingent provided the economy and money market conditions evolve as expected. So in my mind then They are putting a caveat here because what if the economy gets better? Well, then this, this balance sheet's got to change. And the commitments being made now is kind of classic central banking, keeping all options open, committing to nothing but giving a very clear hint in forward guidance. So yeah, two things really to look out for. As you can see, there's a, there's a chat facility on the side of the broadcast. Sam is doing a great job manning that and covering all the different things. So any questions that you have while I'm focused on this please feel free. He's picking up all of the comments. Charlie's there as well, he's part of the team, so they're happy to help. Just while I'm on the, the subject, one of the things that you probably heard was we had a Squawk coming out. I would say for anyone who's serious about trading full-time and certainly intraday, I don't think you can operate without a squawk. It's a necessity, not an option. It's a cost of doing business as far as we're concerned. Not to create opportunity, but a lot of the time to avert potential danger, which could mean cutting a position if there's a piece of news that comes out against your position. It can often act as a great safety net when you're exposed in a position of risk for for sure it kind of pays for itself in that respect. So yep, definitely Squawk services is essential. I'd say we have a trader chat room called Trading Live, of which we have all of our traders in there talking about their trades and their ideas and strategies get shared. That's tradinglive.com if you want to check that out. Otherwise, people like Ranscore are people that provide those types of services. Yeah, Treasury markets still rallying. Bottom right, the US 10-year still seeing some upside. Let's have a look at that chart. Any levels upside in the US 10-year? So yeah, we've exploded through that recent high. I mean, you've got to go back probably a much longer time frame. Let's go to a daily. Yeah, the bigger, much bigger level is coming from that big U-turn from the Fed. Well, this is when yields were dropping like a stone. So if you think about it, this is the bond price, so the yield going inverse. And this was when we had the big equity market shakeout in Q4 of 2018. This was here. That was when, uh, T-notes got up to a peak of just above the 123 handle. Quite a way off that at the moment. I'd say maybe find, uh, I guess the high that was printed back on the 15th, end of last week, would be a logical target, 4 ticks above current price, should we continue to have this dovish kind of interpretation. Press conference, uh, got about 12 minutes.
Hi guys, so everyone's, uh, doing well, enjoying the evening. Uh, 12 minutes or just over 10 minutes now till Powell comes out, so I thought I'd have a quick look over some of the markets. I know you can see them just above me in the middle. You've got the Dow, NASDAQ, and S&P, and Quite a few of you looking at the S&P, really important level that high. And we've, we almost drop it down to 5 minutes, you can see how well it's acted as a resistance. Also the previous high of the day, understandably people taking a bit of profit there. I see a couple of you saying that, so you're sort of risk-free around that area, definitely the right idea to, to have taken some. You can see just the importance of this level going back over the last few days, was the high we had back 18th, really good support going in until the sort of the sell-off we had at the back end of yesterday's session. And again, it's held well. Um, if we were to see a bit of a reversal, um, I'm going to put this on a longer time. The key sort of line in the sand, if you like, uh, is going to be 2824.25, that previous high that we struggled to get through. This goes back all the way to October last year, really strong resistance. Since now we've had that breakthrough, uh, be focusing on, on that as well. By no means do I, do I necessarily think we are going to completely reverse, but just as a word of warning. NASDAQ and Dow obviously very similar in that we pushed up. This is a new high for the year that we just made in the NASDAQ. If we were to continue on, as with a few of these equity markets, probably worth getting a bit of a trend line on these previous highs if that was to come in, looking for that third test to come in around that R2. Definitely an area that I would be focusing on, uh, potentially, uh, later should we go. The dollar index obviously getting slammed. Gold, we saw push up, and that's the, the highest we've been for quite some time, uh, now pushing above 1,300, which acted as a pretty good support level. Key point of interest literally just breaking through that really strong resistance. Where we close the day will be important for a sentiment sort of point of view. Through this, you've got to be looking around to the high of that day as well, uh, on the first of the month. So not too far from a new high, uh, certainly on futures anyway. It's got over just 9 minutes now until that comes out. Mentioned about that euro, so let's bring up that trend channel. People have been talking about. Uh, just going to bring that into picture here. There's a 240 going from the high that we had back on the 9th of Jan. You can see now that significant break. Uh, it would take a lot for it to obviously come back down. That important area— this is obviously looking at the futures— where we're trading now is absolutely massive. You've got the highs that we had back at the end of February, first of the month, so similar to gold in that we're not too far away from that high of the month. How we respect here or don't respect here is gonna be pretty important going forward. Cable, as mentioned in the chat, probably not the best market to trade at the moment off this considering everything that's going on with Brexit. You can see how limited that has been. We're still down for the day on the pound as we did have some negative headlines that came out. However, pretty important level that we're trading at now, so worth keeping an eye on that. And then you've got 133 in the futures just above here. One market that has moved quite considerably is the dollar yen. So you've had really strong push down here in this market, which if we go back and look at this on a longer time frame, you can see— well, I'll put on a daily chart— you can see it's just been pushing higher and higher and higher really the beginning of the year. So this is quite key in terms of can we sustain this push, push lower or not. I'd be a bit wary about this considering if equities continue to rally over the next couple of days, can the yen still strengthen? But worth keeping an eye on, on this sort of retest of any sort of trend line like this that's broken. And I would be looking looking to get short too aggressively, especially right now if you're not already in a position, because of course Powell's about to come out in 8 minutes' time. Let's have a quick look over that, uh, bigger picture again. So S&P coming back up to test it. So NASDAQ pushing above the Dow, just lagging behind a touch. Uh, oil liking it as well, you can see not too far away from its post-DOE highs. And T-notes pushing to a new high as well. Euro still testing that level, but definitely had that marked up as it is very key. The pound is trying to push through, not far now from the 133 handle on the, the futures. But both gold and euro testing that 1st of, uh, of March level, so worth really keeping a close eye on that. And then how of course S&P reacts to this pivot. If NASDAQ keeps going, we definitely can see a drag through to S&P here as well. But just the importance of this— if I just mark that up again— such good price action around here, struggling to go through at the moment. If we were to get that pop through, where next for the S&P? Probably where I was actually just sort of lined up there. You can see in the middle around here, we've had some previous lows really nicely respect to just before 2850, that would be a next sort of target. I see a couple people looking at the R1. Yeah, that with the, the high of the year is also an important level at 2865. This probably is something over the next couple of days which I wouldn't be too surprised to see that come in. I mean, currently we're only about, uh, give or take 3% off the, the all-time high. That next key level, 2866. Or around that on the futures. The low before the global equity sell-off that we had on the 10th of October, you can see the significance of this, this range here for the week, massively important for the bulls and the bears. Below 2824, then I think we have a bit of a sell-off, and I wouldn't be too surprised to see us go down 2720. If we can get anywhere, uh, to 2866 and above, then that move to all-time equities, I do believe comes quite quick. Let's just have a look where we're trading right now. The move would be, yeah, about 3, give or take, just over 3%. So yeah, interesting times ahead certainly for the equity markets. Any questions, please, uh, do get them in the chat. And we've got Powell coming up in about 5 minutes or so. Definitely worth Keeping an eye on S&P again here though.
Okay, so looking out for, uh, Jay Powell to, to come out in a couple of minutes' time. Just to keep you fully prepared, in the chat I've put a link to the Federal Reserve website. Specifically on the right-hand side, you'll see a live video feed here. If you click on that, it will basically give you access to, to watch it live via the Fed website. Bloomberg TV, everyone else will be covering it as well. Yeah, what's quite interesting, Bloomberg TV just talking about the banks have hit session lows after the Fed rate decision. Now what you're seeing in the indices, it's quite interesting, is on the center chart, the NASDAQ is sharply outperforming because obviously the NASDAQ is exempt of any financial representation in terms of its composition as an index. So NASDAQ is rallying, tech stocks are loving life again, the FANGs and so on getting the support that they need. However, financials, their margins are not improving. Not only are they struggling, I guess what has been now low volatility not particularly great, I guess, for execution of trade on behalf of facilitating client flow. But what banks need is interest rates going up so their margin gets bigger, and that otherwise they get— continue to get squeezed. So this dovish surprise, even though equities are rallying on a, on a granular level, you're probably getting disparity here, which is reflected in the NASDAQ outperformance over the S&P, which obviously is more encompassing of all the different sectors. Well, let's have a quick look. I know it's delayed, but there's a— Finviz do a heatmap. So yeah, tech rallying, financials, the bottom right, you can see this is mainly red, whereas you've mainly got green here. Basic materials obviously rallying, dollar weakness, oil's gone bid, gold bid, oil kind of a bit of a dual whammy, I guess, because weaker dollar normally inverse, so gold also rallying. But if you look at gold on a— look at oil on a technical, you know, could this be the cue that oil traders need now to get firmly above $60? $60 is not just a big psychological level, but as you can see here, really it's not a lot up here technically going back over the last 18 months. Until we get up to 6181, and then probably pushing above there some of the further fib retracement levels of the, the broader sell-off we had end of last year, and drawing in some of that other price action up at 63.5. So, um, quite interesting move to keep an eye on, but obviously we're just awaiting Jerome Powell. He hasn't come out yet, should be, uh, any moment now. Again, more what we're looking for from the Q&A is, you know, they've, they've surprised us with a dovish announcement. What I want to know, and the market wants to know, is why. What is it that's driven them to make this decision? How do they communicate that? The more pessimistic he sounds, the more worried he is descriptively, then we could get a further follow-through. If he starts putting caveats to all the dovish kind of pledges from that initial release, then that's when you might get a bit of a pullback on some of the initial moves. Okay, should begin any moment. Powell speaking at the moment. First comments, then, um, I won't— well, let me repeat some of the key ones just in in case you haven't got the live feed on. So it says Fed's overarching goal is to sustain the expansion. Jobs market is strong, we know that, it's not really that important. Says the Fed still expects US economy to grow at a solid pace in 2019. So this is when you get the balanced opinion now. He says the Fed still expects the US economy to grow at a solid pace this year. And again, that's irrespective of that Atlanta Fed model that that's dropped into very low, less than sub-1% growth. But he's sounding quite upbeat, so that's a little bit hawkish. Just keep an eye on EUR/USD. EUR/USD just broken again to the upside. Remember those levels that Sam was just looking at in his discussion? Zoom it out, you can see that picture. So just busted through a bit more firmly those highs that were seen in early March, late February. Powell saying that we'll be patient in assessing any policy changes. I'll put the squawk on as well, so if there's any impertinent comments, you'll hear them squawked. The live link though is in the chat if you wanted to listen to him live. We will reiterate anything important.
Suggesting that growth and inflation could be stronger or weaker than what the forecasts have suggested. Says that much of today's meeting was about what to make of the bearish indicators. Yeah, just while we're monitoring, it could be some time before the outlook calls for a change in policy. Fed's Powell, it could be some time before the outlook calls for change in policy.
Yeah, just for, um, whilst we're monitoring Powell, keep an eye on the chat. Sam's putting some technical levels across different products into the chat, levels he's keeping an eye on, uh, identifying 48.5 in the, the spoo is a good target in the futures. Anything next in the euro, Sam, uh, if you put it in the chat, please. I mean, this is just the benefit of operating on on a trading floor. Sam's our kind of technical guy, I'm obviously the fundamental. So, you know, I'd always rely on him to call out the big levels. Euro still going bid at the moment, so it doesn't look like there's been too much to detract from the initial interpretation. Powell says Brexit trade negotiations pose risks, so that's the tip of the hat to those external factors. So still quite sensitive to those developments. Just having a look at cable as well. There's no Brexit update. Obviously, Theresa May had been speculated to be meeting with opposition leaders and also the 1922 Committee, but since all this Fed stuff's gone on, you can almost forget that, for at least for the moment. For one, there hasn't been any updates specifically on Brexit or May. Two, this market's been driven by the dollar at the moment post the event. 1.33 handle, fairly significant. That was a previous trigger point for some of the price action earlier in the session today. That was the retest and break of the low point from yesterday afternoon. Broke that earlier, retested it before the bigger move down that we had with all the Brexit rumors that were coming out earlier this afternoon. So with the dollar weakness, cable continues to claw back some of those losses and back above a 33 handle now in the futures. Okay, so he's finished his statement. We're now going to go into the Q&A session. Remember, in terms of the structure, the first few questions are typically the most pertinent, potentially the most market-moving. So keep an eye out for the first 3 or 4 questions. First one being delivered now. Being questioned at the moment about detail on the balance sheet. This is key. Okay, so just to give you an idea of what we're going to do, I'm going to give it about another 3 or 4 minutes. Obviously the press conference is continuing. But what I'm going to do is wrap up our coverage. I'm going to talk a little bit about Amplify, a little bit about the stuff that we do that you can access, like events like this. Hopefully you found it useful. A few other bits and bobs as well. So we'll give it another few minutes. We'll let, let you guys monitor Jay Powell. But as far as this session is concerned, when it gets to 6:45 PM London time, I'm gonna stop covering the FOMC and I'm gonna go over a few points about Amplify, what we do, how we can help with your trading if that is the case, how we can help with your fundamental preparation if that's one of the things you're after. If you're a technical-based trader and you want information on that side, we'll go into that in a in about 2 minutes' time. Of course, any other questions that you have at this time, now's the time to ask. So if you put them in the chat room, once I've gone through— and I'll probably spend about 15 minutes going through your questions— fire them in the chat now. Once I've gone over a couple things, I'll be more than happy to, to go over and take any of your questions. Just seeing a couple more tweets, updates about Theresa May. I've just seen a tweet from a guy who's a reporter Sky News Politics, Huffington Post, and the Times newspaper. He is tweeting saying that, confirmed, Theresa May will address the nation from Downing Street at 8:15 PM. So just to repeat, understand that Downing Street crest is on the podium in Number 10 ready for PM statement. So that narrows the possibilities. It's coming from ITV, another Anthony Cheung here, another journalist on the Brexit side, talking about May's going to address the nation at 8:15. Again, our expectation with that is we're not expecting a resignation, far from it. I actually think, if anything, May's going to reiterate her stance quite firmly about delivering the will of the people on balance, and that is that she has a deal. Europe have talked about they'd be happy to give an extension till June. I think this is all now about political leveraging and posturing in order to get Parliament to pass her deal, which I think is going to happen even maybe not next week. Europe could technically grant an extension all the way through to the second week of April. That would lead us then into a decision needs to be made about the— whether we're going to partake in the European parliamentary elections. Which are going to be happening later in the summer, but we need to let Europe know by mid-April. So I think really April 12th is the hypothetical cutoff for me. I think there might be some flexibility for this meaningful vote in the interim period to get refined and to be passed. And so I'm still personally of the belief that we will have a— as much as it can be an orderly Brexit, it's just not going to happen anytime soon. At that point. All right, well, look, Powell's going to continue taking questions, but let's— let me just cover a few other things. So first of all, I can see there's still quite a few people online. First thing I'd like to say is, uh, thank you very much for joining us. I hope you found this session, if you're new to trading, insightful. I hope it's kind of gone some way to explain the way of which how we prepare for these events so that we can determine how and why markets react in the way that they do. As you can see, without really knowing what's expected, well then how do you ascertain the reason why markets have interpreted this dovishly and how do you trade it accordingly? So trading news-driven events, I always say to new guys, is absolutely an advanced type of trading. It's not something that you can do half-heartedly or, or just jump into without really having quite a decent level of underlying knowledge and also a lot of practice. And that comes inevitably with a lot of screen time under your belt. But hopefully, even if you were just looking at this as a bystander outside viewing in and not participating in trading, that it's given you at least a bit of an insight as to how the news comes out, how quickly markets react, what is a large move when something against expectations occurs. These are all things of which you need to do the preparation, understand the execution, and then do the review with every big event. That's the only way that in the long term that you're going to be more efficient at trying to trade these high volatility events, but that will come in time. I know there's a couple of guys— Fez, hello, I can see you in the chat. Fez actually did, was part of the Amplify team when he was going through one of our training programs a couple of years ago. And I know, Fez, you'd be happy to take any questions as well that guys have for you in the chat. I know that you trade your own, your own funds nowadays. In the futures market. So I'm sure the guys might have some questions for you as well. But let me talk through a couple of things. This is the Amplify website. When you come to our website, you're going to be presented with this drop-down box where there's 3 options. So the way that our business works is we have a proprietary trading arm which includes a training kind of division. We also have a technology arm and the technology arm is where we've created proprietary simulation software that's been adopted by most of the big banks in terms of their graduate recruitment process, but also their graduate training programs. We also deliver that training to the majority of large universities across UK and globally, so that would be inclusive of LSE, UCL, Cambridge, and all the other regular kind of big top-tier universities you'd imagine. But that's very much the technology arm. If you were a student watching this, if you just jump on the internship section, we actually have a fully designated summer internship training that we do over the summer. We're actually going to be holding that the first few days of our first intake at Morgan Stanley's offices in London, in Canary Wharf. Morgan Stanley are a partner of Amplify. We actually help them recruit talent in terms of some of their diversification drive because our technology basically measures performance only. We're trying to kind of reshape recruitment where students who, irrespective of their kind of background, should be given a shot dependent on their performance. The one thing that's probably more for you guys listening though is probably the trading, professional trading courses. So we back traders, but we only back traders who've gone through our formal training program. That's a 9-week program. We have really 2 programs that we run. Our main flagship one is a 9-week program where we basically take people a variety of different backgrounds. Some might be people working in bulge bracket banks, but in maybe a mid-office, back-office role, want to rotate into the front office. Some people have never traded before at all, but just have an interest. So we basically start from the ground up and we go through a 9-week intensive training program, of which the final stage, the final 3 weeks, you will trade our funds. Small size, of course, because there's still new, and this is only the beginning of most people's journey. But it's an accredited program, it's actually an advanced Level 5 diploma, so it's very structured. We go through all the theoretical kind of information that you require, practical led though learning through trading on the systems in an intraday basis. And we are a global macro-based strategy trading firm, which means we trade across asset my job, head of analysis, so I started in markets back in 2006. My job is to understand the kind of global macroeconomics, so these kind of news-driven events like the Fed is kind of my, my bread and butter, if you like. And what I try to do for me specifically is teach you guys about how to interpret the news, how to formulate a directional bias in assets based on the news and macro kind of fundamentals. If you go on the, the Amplify website, select the trading courses page, this is the page you will see. So these are the different courses we have. That's the Career Trader program. We have various different intakes. We got one coming up on the 1st of April, got one on the 29th of April, and we've got the last one on the 28th of May. Anthony, otherwise then we don't have any availability for training until September. So we've only got 3 more intakes for the rest of the first half of this year. We also have a 1-week program. This is based in, in central London. Our office where I'm sat right now is just down the road from the Bank of England. It's kind of sandwiched in between Bloomberg's new European headquarters and the Bank of England. So just by Bank tube station. And this would be based here. You would come for a 1-week intensive course, which is as much as we can cover really. It's an introduction to markets covering things like, again, the macroeconomics, monetary policy with me, but technical analysis with someone like Sam and the head of trading, Piers Curran. We'll go into trading psychology, risk management, an introduction to things like bond markets that you might not have had much interaction with before. and then we'll look at lots of other things as well as again time on the screens spent applying some of these lessons learned. So that's the 1-week program. We've got that happening as well in April, uh, on the 1st and the 29th, and also a bit later on, I think there's one on the 17th of June as well. If you go back on this page though, this is the main page here, if you scroll down, this is where and I'll get to this in a second on our YouTube page. Sam and I do morning briefings, but the point I wanted to show you here was this. Sam and I— Sam's the other guy who was on the mic a moment ago— we write together a weekly strategy report which we issue to everyone on a Monday. It's kind of our putting together our strengths of our fundamental and technical view of what we think is going to be the main event. And how accordingly we're looking at different setups. If you wanted this every Monday in your inbox, you've just got to navigate to the website, drop in here your email address, and hit subscribe, and then every Monday that will be sent directly to you. Other things here, this is a couple of reviews from people who've done our course quite recently, and again, we come from a real variety of different backgrounds. Dino really had quite limited trading experience, but now having done the course, she's managed to pivot her career, now working in a trading firm. Mike, quite different, he now trades for himself, his own capital, but still remains plugged into our, our community chat room with all our traders where he's very active. And then Will, Will actually worked at Goldman Sachs in hedge fund sales for a number of years, but is is again pivoting into the buy side and looking to get a junior portfolio management role. So he came to us to, to get that front office kind of risk-taking experience before he could then utilize his already existing knowledge, which is great, but getting some of that exposure trading live funds in that sense. So yeah, a couple of things there. Otherwise, apart from the website, this is the Amplify Twitter page. Every morning I will be tweeting the main stories that I see that come out on Reuters, Bloomberg, so it could be quite useful for you first thing in the morning. So our handle here is @askamplify. I myself have a Twitter account. That's me without my binoculars on, and my handle is @awmchung. So for me, here you can see the slides that I used as part of our conversation that we had earlier in the run-up to the event. But I put forward basically my thoughts, my opinions, any interesting analysis that I do I'll be talking about. So this could be quite interesting for you to follow as well if you're interested in markets. Um, Sam, who came on the mic, apart from being a a keen golfer. He also does talk about markets as well. He's a good person to follow though because he looks at things in a very different light. He absolutely has a firm grasp of fundamentals, but he's very much a technical-led trader. Amplify, even though I feel we're, we're strong on the fundamental side, that by no means is a is a preset determining factor of how we trade. Technicals are absolutely part of that, that understanding. So he's a good person to follow. And then of course the YouTube channel of which you're taking part in today. If you haven't already done so, please subscribe to the channel. If you turn on the notification bell, every time that we go live and session like this, or anytime we upload a video, you're going to get an alert. You'll be able to watch it as soon as it's fresh and it's just come out. One thing that might be most useful for anyone, if you're interested and you are trading more full-time, or even just to develop your knowledge if you're a student and you really want to connect the theoretical studies at university to something more applicable in, in the marketplace, so you're getting ready for assessment centres for interviews, then one thing that's— that can be very useful on the feedback that we've got from students is this, which is the morning briefing category. So for example, this is something that me and Sam deliver half past 7 AM every morning to our traders. It then goes up on YouTube thereafter about 8 AM, but that's accessible every day. And it's a— if I click on today's one It's a 25-30 minute review of the overnight news, our thoughts and views ahead of the intraday session. All right, that is it. I hope you enjoyed the session. I hope it was useful. Quite an exciting one actually. I'm still surprised by the event. I mean, the Q&A looks like a bit of a non-event given the way that markets have been reacting while we've been talking. But again, thank you very much, guys, for joining us. We'll see you again for the next event. All right, take care.
More from Anthony


Inside the Biggest Banking Stories You Need to Know This Week (Anthropic, Diageo, Private Credit)


Inside the Biggest M&A Deals You Need to Know This Week (UniCredit, GameStop, eBay, Eli Lilly)







AI Breakthrough or Hype? Anthropic’s Claude Mythos, Tim Cook Steps Down & LIV Golf Collapse