Global markets bounce after another day of carnage yesterday
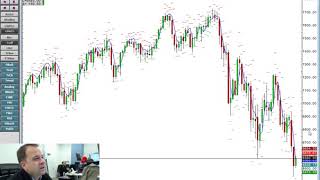
Markets sold off across equities, commodities, crypto and bonds. The Nasdaq and S&P 500 hit record lows, crude fell below $55, and Bitcoin dropped to $4,000. A technical pattern last seen in 2002 suggests the "buy the dip" trade is broken and weakness may continue.
Chapters
And carnage would be a decent word to get the ball rolling for the briefing when we're firstly looking back at what happened yesterday. And you know it's bad when you're starting to get headlines like this Bloomberg headline this morning: Worst day of an awful year leaves no corner of market unscathed. I've seen some headlines talking about— I'm not quite I'm not quite sure how they calculated it, but worst day for 50 years. I guess they're talking about the value of equity that's been wiped off the planet as we've had stock markets plummeting. But really, yesterday was one of those sessions, and it's more of the same. So this has been the theme of the week, it's been the theme of, well, the last month and a half. And it's one of, you know, maybe this is the moment where we are going to start to see equity markets correct and not start. We've already seen it. So this is the Nasdaq. But the point about yesterday's session, there wasn't many places to hide. Pretty much everything went down. This is the Nasdaq weekly chart, made new lows since back in April. But if you look at crude oil, we're definitely going to be talking about crude oil this morning. Big crash down through the $55 handle, big, big technical breakout down to $52.50. Bounced a little bit this morning, emphasis on the word little, but carnage here over in energy markets. It doesn't matter where you look. Bitcoin got savaged yet again on the downside and traded down to actually very briefly the low yesterday, just around $4,000. That's That's Bitcoin down 80%, um, and it wasn't— and it was similar for all the other cryptocurrencies. But it doesn't, it doesn't matter where you look really. You're at 115 Cannon Street, London. Thanks, thanks Siri. It doesn't matter where you look, um, you've pretty much got a bloodbath. So let's just go back and, and look at some charts, because when I say it doesn't matter where you look, here is corporate credit, um, so in the bond market space, you're starting to see bond spreads hitting levels that haven't been seen for a couple of years now. This is high-grade bond spreads. That's the spread between high-grade US corporate debt and US Treasuries. So spreads are on their highs. Let me just turn that down. So Yeah, the, the point is that it doesn't matter where you look, um, things came crashing down. Here's some headlines that have grabbed the attention this morning. Of course, we've been talking about technology a lot, and certainly Monday's session was tech-led, and the NASDAQ massively underperformed. The NASDAQ was down almost 4%. Yes, all other markets went with it, but, uh, the losses, let's say, on the S&P were about half of that. 1.9%. This is Monday's session, but yesterday the NASDAQ dropped again, another 2%-ish. But the thing— or is actually 1.8%. But the thing about yesterday was the S&P's downside was actually slightly larger than the NASDAQ at 1.9%. So Monday was definitely tech-driven, Tuesday was then everything else following suit. Some, some quite interesting stuff. Here's a chart for you. The FANGs. So these are those 5 stocks that have been the uber outperformers 2017, first half of 2018, this massively crowded tech rally. And the 5 stocks: Facebook, Apple, Amazon, Netflix, Google. These have been the giants and the massive outperformers and the hedge funds' best friends. Well, not anymore. So all of these have come crashing down, and quite staggeringly The drop now from the recent highs puts the, puts it at a $1 trillion loss in, in the market cap of these companies. So Amazon's actually just about beaten Apple to this booby prize, even though Apple's lost $265 billion in value. A lot of that in the last 2 days. Apple down 8.5% just this week. Amazon's actually got the prize here, down almost like $275 billion. Facebook certainly contributing. And then the smaller guns— Google here is actually, you would say Google being represented by Alphabet here, actually relatively unscathed, as is Netflix. But Netflix were the kind of one standout here where they had some pretty impressive Q3 earnings. So Netflix got a bit of a rebound. Uh, but it's still lost, um, knocking on the door of $70 billion despite some phenomenal Q3 earnings. So these stocks, this is that crowded trade, and, and look, the party's over, isn't it? I mean, let's face it. And here's a good, um, chart. It's just gonna— because the— this is a great shot. This is one of my favorite charts of the year. So this is looking at There's a mentality, or there has been in markets for many, many, many years. It's called buy the dip, BTD. Or if you want to put an F in there, then, then go ahead, BTFD. I'll let you figure out what F stands for. But buy the dip is that mentality where if equity markets drop, just buy. And after the crisis, that was born out of the idea that the central banks would always be there. To support. The central banks will pump in more QE, more rate cuts, and all the rest of it. And one of the things about 2018, of course, is, all right, the Fed, not only did they end their stimulus program back in 2014, but of course they're hiking. And this year, 2018, and we're expecting a hike in a few weeks, will be— we'll see the fastest rate hiking year since before the financial crisis more than a decade ago. Of course, also notable about this year, the ECB have been winding down their QE program. It's now just €15 billion a month, and that'll be zero as we hit the end of the year. So, you know, you've got two world's biggest central banks. One of them is hiking at its fastest rate for more than a decade, and the other one is, is finally coming to the end of its stimulus program. And this is one of the key— we used to talk about things called the Bernanke put. Which was basically referring to the Fed president. I mean, that's two presidents ago now, but the guy who was in charge before Yellen and the Bernanke put was something that investors used to describe as, look, if stocks go down, buy the hell out of it because Bernanke is going to come in with more QE. And it was one of the best kind of strategies. But this chart I'm showing you here is looking at average daily S&P return. If the previous week's return was negative. So the point is, if we had a down week, buy it because markets are going to go back up. Except this year, you can see that the average daily return in the previous— if the previous week was negative, is now negative, meaning that this year for the first time, and it's the first time since 2002, this is the first year where if we've had a bad week last week, we're probably going to get a bad week this week. It's the first time this has happened since 2002. It hardly ever happens. And the most worrying thing of all of this on this chart, I mean, each time it's had— it didn't even happen in the, in the financial crisis, which is quite extraordinary. I don't quite know how that's managed to be achieved, but mostly this happens just before a recession. So we've got, you know, one of the big fears that's driving this sell-off, of course, is that global growth has peaked. Certainly developed market growth rates have peaked. 2019 will be a story where growth rates start to slow. And of course, the rest of the emerging market world is dependent on developed market growth. You know, when you get charts like this— so this was the German GDP print from last week, quarter 3. Oops, minus 0.2%. Japanese GDP for Q3, negative. When you start getting charts like this, it just feeds into this fear that actually this is the top and 2019 is going to be a different story. And so what happens, of course, when we don't have a central bank to prop things up, or we don't have a central bank who's willing to prop things up— quite the opposite with the Fed, who are hiking— well, then of course this translates into investor fear. I wouldn't call it panic yet, by the way. I don't know, it's hard for you if you haven't been in markets that have been selling off sharply. Let's go back to this Nasdaq and I'll go to the daily chart. I wouldn't yet call this panic. It's definitely high momentum downside for sure. Yes, led by tech, but now being joined by everything else. And what happened yesterday, of course, is we smashed through the October low. We've been talking about this technical level all week. Incidentally, as the NASDAQ tries to rebound here this morning, we're now testing this October low from underneath as I speak. So, but this is, you know, when we're talking about— I mean, the NASDAQ's volatile, talking about, you know, 2%, 3%, maybe 4% at a maximum. You know, these are big down days, don't get me wrong, but that's That's fear. That's, that's not panic. Panic is, you know, double that, double the size of those moves. And we're definitely not at panic stations yet. But obviously this is getting pretty desperate. And as the sell-off continues, of course, more and more people cave, i.e., those that are still hanging out for the idea that actually it is still buy the dip. Well, this is painful. And at some point that pain threshold gets breached and at some point they say, all right, fine. The buy the dip trade's done, will sell as well. And of course, this kind of then creates this self-sustaining downside. Let me just take you back and look at a couple of other graphics here. Just, just stealing some great charts off Anthony Cheung's Twitter feed. He won't mind. This was the look at the S&P 500. And this is where, you know, if your stock's down, it's red. If it's up, it's green. This is a slightly tricky one for me. I can't— well, I don't know. I can't see any green on that, but that doesn't mean there isn't any. I'm red-green colorblind. Someone else is going to have to tell me if there's any green on that, but it looks, looks pretty red to me. Oh, hang on. Google and Facebook. Here we go. Google and Facebook. There you go. Quite remarkably, were up on the session yesterday. They obviously got killed on Monday. But Apple, which is now in the consumer goods sector, incidentally, if you hadn't realized, they did a rejig of the sectors and Apple's got shifted into consumer goods, adding another near 5% downside yesterday to the, to the kind of 4% downside from Monday. So Apple's just getting taken downtown here. But obviously a sea of red. This was quite a good chart because we often focus on Bitcoin when it comes to crypto, but this is the crypto chart. Ethereum down massively yesterday as well. Forgive my ignorance, I actually don't know what XRP is. Ripple. Thank you. That's the code for Ripple. Thanks, Charlie. But you can see every— all of this stuff's getting hammered. So one of those sessions, I'm going to just show you the Bitcoin chart because we are getting a pretty strong rebound here this morning. Not that you can really see it on this chart, but I showed you this the other day. But that break of 6,000 and then the break of 5,000 and then the test of 4,000. Where's the bottom? It's very hard to kind of judge, but we are getting a little bit of upside. Yeah, again, emphasis on little, but we bounced from 4,000 up to 4,500 this morning. By the way, that's more than a 10% rebound. Even though we're still within this downtrend, just on a 1-hour chart, these little waves here, these are 10% plus moves. I mean, this is volatility that is not, not good for your blood pressure. Let's forget about crypto because it's not massively important to the workings of the global economy. Let's turn to something that is crude oil. So As well as stock markets getting routed yesterday, crude oil is definitely at the front of this collapse. And this is quite an extraordinary weekly chart here. So we got 1, 2, 3, 4, 5, 6. We're going for 7 weeks in a row to the downside. And these are not small moves, you know, coming off the top. Remember, I mean, this is literally just in October we were trading and we hit almost $77. Quite extraordinary, the steepness of this decline. So touching down to $52.50. A lot of this technical yesterday, breach of the $55 handle. We've been talking about this price all week, that key top from end of 2016 to start of 2017, $55. If we go to a 60-minute chart, you see what happened when we took it out yesterday afternoon. It opened up to, to become— uh, let me just remove that trend line— a, a very accelerated move. And in the end, I mean, this is a lot. This is definitely— I'd say this leg yesterday afternoon was technical. Um, I think the downside, like yesterday— sorry, Monday morning— was more off that kind of supply risk side where we're potentially expecting the Saudis and maybe the Russians to cut production. But then That got— the chances of that got reduced by some comments suggesting that that was not a done deal. So Monday morning was about supply side. Yesterday is definitely about demand side. So as the global economy takes a nosedive in terms of expectations, the global economy has not taken a nosedive. We're expecting that maybe a nosedive is coming. That's why markets are moving the way they are. And of course, if the global economy growth rates slow, well, then oil demand slows. And so these two play hand in hand and the oil prices drop. So I've got this wrong. I didn't, I didn't expect a break of $55, but that kind of wave of fear yesterday has definitely taken us down there again. We've had a very strong rebound this morning. If you just look at it in isolation, it's almost a $2 rally off yesterday's low. But of course, set it alongside yesterday's session. We're not even halfway back. If you put a Fibonacci retracement here, we're just testing the 38.2 fib for you technicians out there. The 38.2 fib of yesterday's range is today's pivot, and we're just finding a bit of resistance around that point as I speak. So that's like, like the global market situation. Sentiment couldn't be— well, it could be more negative, but it Couldn't be much more negative. Let's turn our attention to a couple of other stories. I want to talk about Italy. We've had a bit of news this morning, but first I want to talk about yesterday. And here's a, here's a good chart for you because Italy is one of those concerns, you know. If you're— let's kind of just recap actually, you know. We talk about this negative sentiment in markets, but, but why? And so you've got your big headline stories which we've been talking about all year, but just to remind you The big global negative stories for those bears out there are the US-China trade war risk. And we've seen that elevate this week because of the APEC summit over the weekend going badly. We've been hoping that the G20 summit at the end of November would see Trump and Xi Jinping make progress on talks. But that's— the likelihood of that has been reduced because of the APEC summit last weekend. So the China-US trade war, definitely number one. You've then got the US Fed hiking cycle, number two, which has led to things like dollar strength, which has been really painful for emerging markets. You've then got this, this kind of economic cycle fear that we've reached the peak. And, you know, corporate earnings in the US have peaked and growth rates globally have peaked and we're maybe going to slide into a negative 2019. Okay, so these things are kind of all come together. You then got other stuff in the mix which is more isolated at the moment but have the ability to explode. So number one's Italy, Italy deficit risk. I'll talk about that now in a second. Obviously you've got stuff like Brexit, um, and then you've got stock-specific stuff, um, like the Renault-Nissan boss getting arrested, like the General Electric saga with the share price down like 30% in the last couple of weeks. You've got, you know, all the fears around tech having peaked and all the rest of it. Okay, so, but this is— I wanted to just focus back in on the Italy story here. What I'm showing you here is a chart, and we talked about this during yesterday's session. This is the Italian 10-year yield spread to the German 10-year yield spread. This is the best measure for internal kind of eurozone risk, if you like. And we're worried about Italy. We're worried about their debt sustainability. On the one hand, they've got chronic lack of economic growth, and on the other hand, they've got a huge amount of debt. And we're worried that it's not sustainable. And the government in Italy want to borrow more money to go ahead with a stimulus program to boost growth, but that would result in their deficit widening beyond European budget rules. And so the European Commission are pushing back and saying to Italy, "Look, you can't do that because that breaks our rules." And Italy's government are saying, "Well, we are going to do it." And Europe's saying, "Well, you can't do that." And Italy's government are saying, "Well, we are going to." And we're not quite sure where this ends, right? This is for a 2019 budget, so we've got 6 weeks yet until we really see what happens. But the point is that as that fear that Italy's debt sustainability gets worse, well, their bond yields rise. Okay, and this is looking at the difference between Italian 10-year bond yields, the cost of borrowing for Italy's government, and Germany's 10-year bond yields, the the cost of borrowing for Germany's government. And Germany are the safe haven of Europe. And the spreads have been widening over the last couple of weeks. If I just get the x-axis in view here, in November spreads have widened again. This is the Italian yields rising, and we almost tested the October high yesterday. So this is something to look out for. Okay, it's that Italian risk rearing its head again. If you do get a breach of this key level around about 1— sorry, 3.3%, that's the difference between the two bond yields, then this story will go back onto the front pages. One thing this morning, you can see that actually the spread has dropped quite sharply. So a bit of an update on this this morning. The Italian Deputy Prime Minister Salvini has said that we could potentially be open to budget revisions. So actually, this is a new First time we've heard this from the Italian government. Some kind of indication that maybe they're prepared to back down a little bit in the face of pressure from the European Commission and maybe change their budget strategy to make it less deficit negative. So that's why you've seen these yields pull back slightly. One other story to kind of gauge this is demand for Italian bonds when Italy issued new debt. What Italy have been doing, which is very unusual when you're looking at big governments, they've been issuing debt ever since 2012. Every 6 months they have a BTP Italia bond auction, which is where they sell debt to the public. This is where they sell their bonds directly to individual investors as well as then institutional investors. But it's unusual. You wouldn't normally see a government of that size borrowing money from individuals. They'd normally just go through the big banks, the primary dealers, and there's sufficient demand there, no problem. Well, Italy's government have been turning to the public for the last 6 years. So every 6 months they have a bond auction, and typically over the last 6 years the bond auction has typically raised between €7 and €8 billion each time. Okay, well, they had a bond auction this week. It's, it's that 6-month time. We have a BTP Italia It's on now. The auction takes 3 days. On the final day, institutional investors are allowed to get involved. And the first couple of days of this has shown very weak demand. So normally they'd raise €7 to €8 billion. Well, analysts are expecting them to let— to now raise less than €5 billion this time. And this is a clear indication, potentially, that you're really seeing a loss of demand for Italian debt, which is because of concerns around the debt sustainability. So another something to look for. We're going to get the final results of this auction today, or maybe it's tomorrow. I'll need to check that and I'll update you. But yeah, this Italian saga needs to be on your radar, although good, good soundbites from the Deputy Prime Minister this morning to ease concerns. You've actually had— you've seen that feed through onto things like the EUR a little bit this morning. If I just transition my screenshot here, we've seen the EUR lift a little bit higher. We've broken up through the pivot again. This is just making retracements. It's quite similar to oil here where the pivot today is also the 38.2 fib of yesterday's downside. We had some dollar strength through yesterday's session as well, of course, which helped to tip commodities and oil lower. But the euro's had a little bit of a boost this morning off the back of this positive soundbite from the Italian government. Right, so that's Italy. Let's talk Brexit, of course. Well, what to say about Brexit? Well, interesting news. Theresa May's opened the door to maybe revising the Italian backstop. We thought that the draft withdrawal treaty was done and Europe aren't interested in renegotiating any of it. Well, maybe they are. Well, I don't know yet. We'll find out because Theresa May is going to Brussels today. She wants to reopen the idea of using technology at the Irish border to prevent a hard border. So you can still have Northern Ireland in the UK and you can have the Republic of Ireland in the EU and once the UK's left the EU, you could still have a border that doesn't have a fence and customs checks, and instead just uses clever technology to track goods. And so this is something actually the hard Brexiteers, that the Boris Johnsons and the David Davises of this world, actually they raised this 2 years ago as the solution, and it kind of got downplayed and rubbished because Well, technology's not advanced yet enough. But here's Theresa May potentially bringing this back onto the table, and this is to try and appease, of course, the Eurosceptics in her cabinet. This is to try and make sure the Goves and the Leadsoms of this cabinet are on board and stay in the cabinet and don't resign this week. What Brussels think about this idea, we'll see, because she's going to Brussels today. So that's something to take note of. The other thing of interest was we had a YouGov poll over Monday and Tuesday measuring Theresa May's popularity, and actually she hasn't been this popular for more than 12 months. So Theresa May's ratings are on the up, and in fact those wanting Theresa May to now stay as Prime Minister has risen from 33% last week 33% of people wanted her to stay. That's risen to 46% this week. And in terms of the opposite, who wants Theresa May to go, to not be PM anymore, last week 47% of people said they wanted her out. That's dropped to now 34%. So as I was saying yesterday, Theresa May is actually having a decent week given that it looks like she's going to avoid this vote of no confidence. Jacob Rees-Mogg is looking increasingly more— or his position is increasingly being undermined. And Theresa May almost has got a position of strength here. Quite remarkable. And that's been showing up in the YouGov poll. That's one reason why I think the pound's been quite stable this week in amongst the absolute carnage across global markets. The pound, what, is trading the same price it was on Friday last week. I mean, what's all the fuss about? So for once, it's sterling and Brexit volatility is taking a breather. And just to keep you entertained, the rest of the planet has gone into hyper overdrive. So, yeah, cable and Brexit really off the menu in terms of the global outlook. But do keep an eye on this as we've got Theresa May in Brussels today. So obviously headline risk on that front. Right, that's pretty much all I wanted to cover, uh, today. Let's have a check-in on what's going on in terms of the economic calendar. Um, so data-wise from Europe, nothing. Um, like literally, we've got some UK data in 25 minutes, but this is not of any importance. So really it's about the US data today, and we've got quite a lot of it. Just they're trying to bring it all forwards into, of course, this being the final trading day of the week for almost all American traders. Tomorrow is Thanksgiving. Friday is not actually technically a holiday in the US, but everyone takes it off as a holiday. So tomorrow, markets totally closed. Friday will be a very, very shortened and very low-volume session. So really, this is the last full day of the week for US markets. So you've got initial jobless claims, existing claims, Uh, you got University of Michigan consumer sentiment. This is the final reading— come very early, I have to say, for a final reading. Um, but anyway, a final reading nonetheless for this sentiment. And then of course we've got the oil data at 3:30, which will be the big one given what's gone on with the oil markets this week and over the last 7 weeks. So that's a major event today, that Department of Energy, um, number hitting the wires at 3:30. Who's speaking? Well, more from the Bank of England, Carney talking again. But yeah, Prime Minister May meeting with European Commission President Juncker. But do be aware of the timings of that, that's at 4:30. So you might get some comments from both of those beforehand, some doorstep comments, but most likely we're gonna get anything, anything notable will come after that meeting, and that'll be to tonight at some point. We're not quite sure when. Um, right, so that's it. I mean, at the moment, just to wrap, at the moment, um, well, there you go. The NASDAQ, as I've been talking, has managed to get back up through the October low. So actually, at the moment, you're, you're seeing a, a little bit of a rebound being staged for this NASDAQ. The next level to look for, I'd say, is that high point we had into the European close yesterday and the low from Monday. Around 6625. So you're, you're getting a little bit of a revival here on the Nasdaq. Check out your crude oil charts, which are also showing the same. You've got a similar pattern on euro-dollar thanks to that Italian comment. So, and indeed, I might as well include it, Bitcoin as well. So these big moves from yesterday to the downside are being retraced as I speak. But we'll have to see how long this lasts. Downtrend still very much the, the order of play. All right, thanks a lot, guys. Enjoy the session.
More from Anthony


Inside the Biggest Banking Stories You Need to Know This Week (Anthropic, Diageo, Private Credit)


Inside the Biggest M&A Deals You Need to Know This Week (UniCredit, GameStop, eBay, Eli Lilly)







AI Breakthrough or Hype? Anthropic’s Claude Mythos, Tim Cook Steps Down & LIV Golf Collapse