Head of Trading's outlook for week ahead
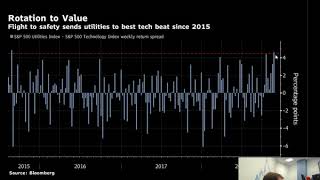
In this market briefing, the Head of Trading provides a comprehensive outlook for the week of late November 2018, covering U.S. equity market dynamics, recession probability surveys, sector rotation, Treasury yields and the yield curve, and a range of macro‑economic and geopolitical events that could shape market sentiment. He begins by analysing the recent volatility in the S&P 500, noting a 3.8% weekly drop, a correction of over 10% from recent highs, and an unprecedented 63% of constituents trading below their 200‑day moving averages – a breadth signal not seen since 2015. He questions whether the sell‑off signals a deeper downturn or a buying opportunity, referencing the historically strong December “Santa rally.” He critiques economist recession forecasts (15% probability, a decade‑low) as historically unreliable, and highlights a surge in low‑volatility stock performance versus the broader market, suggesting a flight to safety. Sector rotation is evident as utilities outperformed technology for seven consecutive weeks, echoing patterns last seen in 2015. The briefing then shifts to macro events slated for the week: OPEC‑JMMC meetings and a G20 summit that include oil‑producing leaders, with crude oil hovering around $50/bbl and technical support at $42. Potential production cuts or lack thereof could drive oil sharply lower or trigger a rebound above $55. He notes political pressure from President Trump for lower oil prices and speculates on Russian and Saudi stances. European concerns include German IFO data (slightly below expectations) and Italian government discussions to lower the 2019 deficit target to 2‑2.1%, which lifted Italian 10‑year bond yields and the euro. Brexit developments are outlined, with Theresa May’s deal signed, a forthcoming parliamentary vote on December 12, and several possible outcomes ranging from approval to a no‑deal scenario, each with distinct market implications. U.S. monetary policy is highlighted as a key driver: Fed Chair Jerome Powell’s upcoming speech and the release of Fed minutes could signal a “dovish hike” in December, potentially pausing rate increases in 2019. The briefing links the recent oil price collapse to deflationary pressure on the CPI, which could give the Fed breathing room. Treasury markets show a double‑top in 10‑year yields, now near a 2‑month low around 3%, while the yield curve has halted its steepening, keeping the spread between 2‑year and 10‑year yields near historic lows – a classic recession indicator. Finally, the briefing notes a sharp decline in Bitcoin, with futures below $4,000 and spot near $3,500, a 41% drop since early November, underscoring broader risk‑off sentiment. He concludes that the convergence of OPEC talks, the G20 summit, Fed commentary, Brexit vote, and other data points makes the week pivotal for the remainder of 2018.
Chapters
So just to give you a heads up, what's going to happen, what we're going to cover on the briefing this morning. We're going to take a look at the— well, what I'm showing, what I'll show you first is the US equity space. Let's have an update on what happened, another heavily negative week for global stocks, but we'll look at the US specifically and we'll talk about recession risk. We're going to slide over and of course give an update on Brexit with Theresa May having returned from Brussels, having signed on the dotted line We're going to be talking about Italian deficits. We'll talk about OPEC, about G20. We'll look at the week ahead where we've got a really important week. We've got important comments from the Fed's Powell, for example, and we'll have a look at interesting moves in things like Bitcoin. So definitely a lot to cover. So let's, let's get cracking. Here's the chart of the S&P 500. Daily chart, just kind of capturing the sort of violence that Q4 has, has displayed so far and is probably going to continue to. And it really has been a Q4 story, of course, because it was the— it's actually the 3rd of October, which was the 3rd trading day of Q4, where we topped out all-time high. So 3 days in, we hit a high. But really, of course, ever since then, it's been you know, some of the sort of volatility, market volatility that we haven't seen for a long time, of course. So, you know, one of the critical questions for investors here, as we had another really negative week, I mean, if we have a quick look on the weekly time period and talk about weeks and just zoom in a bit here, then this big red candle that we had last week You know, it's really taken the wind out of the sails again, and it's really got investors, you know, asking that important question, you know, is this turmoil, is this just the beginning? You know, are we going to see the break of the low point that we had back in February, or is this it? Have we overreacted? And, you know, can the S&P do what it normally does in December, which is rally. The, the Santa rally is pretty consistent in terms of December always being one of the best months of the year historically. So that's the big question for investors. Is this the beginning of something much more ugly and meaningful and stocks continuing to come under heavy pressure, or is this, is this the best buying opportunity of the year? So let's have a look. There was quite an interesting article in Bloomberg, Bloomberg this morning, that kind of covers some of this. I mean, firstly, here they're looking at the fact that the S&P dropped 3.8%. This is last week, so you can see back-to-back negative weeks, and of course last week being one of the biggest. We've had 3 big negative weeks where we've seen the market drop, you know, on average around about 4% on those 3 weeks. We're into correction territory, meaning the S&P has now dropped 10% from its recent highs. So obviously this is just looking at the top-level equity index as a whole, and clearly it's been a very negative period. But if you start looking a little bit more closely, this is interesting actually. This is the wrong-way momentum. This is the percentage of the S&P stocks that are above the 200-day moving average. So this means, of course, that the vast majority of stocks, the percentage— so yeah, we've got, what would that be? So you've got 37% of companies are trading above their 200-day moving average, meaning 63%, so two-thirds of the, of the whole index are not only down and negative, they're below their 200-day moving averages. And of course, You can see this hasn't happened. You've got to go way back to 2015. This actually is quite interesting. And I think this chart nicely sums up why this sell-off we've had in October and November is different to the sell-off we had in February. Because let me take you back. Have a look at the actual S&P chart here, because at the moment, as it stands, you would say the sell-off this time, October, November, isn't as bad as the sell-off we had in February. But then when you look at this graphic, well, then actually it's suggesting that the sell-off this time around is way more broad-based. And of course it had and was started and kicked off and led by the tech sector. But as we were talking about last week, Monday saw huge underperformance by the NASDAQ. It was technology dumping and everything else following. It was actually the day after where tech held fairly steady, and everything else sold off. So it's definitely a tech-led, um, sell-off, this, but it's now definitely very broad-based and something we haven't seen in an equity market sell-off, as you can see, since way back in 2015. So much more broad-based. Um, this is looking at US recession probability forecast. So one of the weird things then about this sell-off is, yes, broad-based and something we haven't seen for a long time, but According to this survey, and this is economists being surveyed, what's the probability of a recession within the next 12 months? And the probability is still rock bottom. You've only got 15% chance of a recession. It's been pretty much at that level for 10 years. So right now, at the moment, the economists are suggesting that there will not be a recession in the next 12 months. However, should you ever believe economist forecasts is the important question. And if you look at the 2008-2009 crisis, of the 60 kind of leading US economists that were surveyed regularly, not one of them predicted that recession 12 months before it happened. And let me just show you a couple of other stats on this. Um, yeah, so, so only— so looking at the recessions of the 1990s, for example, only 2— this is all the recessions. There were 60 recessions in the 1990s. That means 60 different countries had a recession at some point in the 1990s, and only 2 of the 60 were actually predicted by economists. So what Whilst this chart gives the bulls some confidence, I mean, I think honestly it's probably one of the most pointless exercises surveying economists to predict whether we're going to have recessions or not, given how spectacularly they failed to predict them in the past. So I don't think you should pay too much attention to the fact this is still rock bottom. This is looking here at the volatility index, if you like. It's the Invesco S&P Low Volatility ETF minus the S&P 500 monthly performance. It's looking at the spread between low volatile stocks and the index. And as you can see, we've had a big explosion, um, in the last couple of months. So in October and in November, investors not only have been broad-based selling— so 63% of companies are below their 200-day moving average. But also we've seen a real switch into low volatility strategies. Again, another kind of surefire sign of a safe haven type of flow as investors generally are preparing for that late part of the cycle. And maybe the recession is on the horizon. So this is more evidence in that camp for, you know, we've definitely peaked, the cycle has peaked and It's, it's kind of deceleration on growth through 2019 to an inevitable recession. And then final chart is looking at defensives. So this is looking at the S&P 500 Utilities Index and the spread between that and the technology index. Okay, so here are your two kind of classic opposing sectors. So you've got your defensive utilities and you've got your cyclical tech technology stocks. And as you can see, of course, this is the weekly chart. So all of the last 7 weeks where we've seen markets come under huge amounts of volatility, every single one of the 7 weeks has seen the utility index outperform technology. So again, and some of these bars, and particularly last week, importantly, you saw tech really roll over and money pouring into that defensive utility space. And you've got to go back to 2015 again to find the last time you had such a massive rotation of assets from cyclicals to defensives. So certainly investors are saying we've peaked when you're looking at how stock markets have behaved. Normally investors have been more accurate in predicting recessions than economists have. So we kind of go into this week then and, you know, as well Where do we go from here? And I think the average— well, here's another chart which I can't enlarge, I'm afraid, but equity exposure reaches the lowest level since 2016 amid the S&P drop. So where, where do we go? And one thing that's, that's kind of, you know, at least not worsening is this yield curve situation. I'll talk about this. Perhaps I'll come back to this chart because one of the key things that's happening this week And actually, let me maybe look at that. If we look at what's going on this week, let me make this a bit bigger. We've definitely got an action-packed week. This is a pivotal week in my opinion. I think that, you know, other than the Brexit vote in Parliament that's going to be scheduled for December 12th, other than that, I would say this is definitely the most important week remaining in 2018. And the reason why I say that is because you've got two critical— well, perhaps got three critical things happening this week that could well, you know, see major developments in, in three of the, of the major forces on global markets. Okay, so number one, and like, in order, you know, in chronological order, Tuesday we get OPEC. Um, now the OPEC meeting itself isn't till next week, But we have OPEC meeting, the JMMC, which is essentially the warm-up sort of pre-meeting ahead of the actual OPEC meeting itself. And let me— whilst I mention this, of course, we need to look at the oil chart because it's not just stocks that have been selling off. This is the daily chart for crude oil. Again, on Friday, big, big downside. One of the, one of the most negative weeks we've seen for a long time. And this comes after what's been 6 negative weeks before that. And we touched down on $50 on Friday, and we've just held firm on that so far today and bounced, and we're back above $51. But I mean, what a, what a collapse this has been. And so it's quite a critical week for oil, and we'll talk about the inflationary aspect of this chart when I talk about the Fed in a minute. But you know, what goes on with oil here now that we're down at $50. We've been calling some pretty major technical levels, and certainly the $55 handle was definitely key. And last week when that broke, I mean, it really was then freefall as we moved $5 further south to test the key $50 handle. So we're at $50, very psychological, and OPEC are meeting tomorrow, and we've got further meetings. So if I switch back It's not just this OPEC-JMMC meeting tomorrow, but actually the G20 summit starts on Friday, and we'll talk about Trump and China and trade war risk in a minute. But another thing that's happening at the G20 summit is that all of the major oil leaders, let's say, so you've got US and Russia, of course, but Saudi Arabia and some of the other OPEC heads who are from countries that aren't in the G20 But they are flying to Buenos Aires for what's billed to be some kind of major global oil producers meeting. So you've got the OPEC-JMMC meeting tomorrow and then this meeting on the sidelines at the G20 on Friday. And this is really going to be critical. What comes out of these meetings will determine whether $50 is the bottom, is the floor or not. And if it is not, then, you know, we're looking, we're looking you know, looking— diving into the low 40s here, because the critical technical level below $50 really is at $42, which was a major kind of low back November 2016. It's the key 2017 low. So if these leaders can't agree on some kind of action by way of production cut, then if $50 gets taken out, we're probably going to hit $42. I would suggest. However, if there is some kind of consensus amongst these leaders that $50 is too low now and there's some kind of coordinated action, well then obviously there's some, there's some very sharp upside potential as well with a knee-jerk snap reaction back above $55. But don't forget Donald Trump is most likely going to be calling for more downside here. Trump wants the price of oil to go as low as it possibly can. So I'm not quite sure what Putin's thoughts are. That's the thing, um, he's a bit nonchalant on this, doesn't really care too much. So it'll be interesting to see what his stance is at some of these meetings this week. Okay, so definitely oil critical. Um, so what else? And if we just kind of pick through this, we've got Draghi talking today, we got the German IFO data also. I just need to keep an eye on that. Um, we've had some very bad German economic data, remember. Negative GDP print for quarter 3, uh, nosedive on their manufacturing PMI, um, in the flash November estimate from last week. So real concern around that kind of economic momentum story in Germany. So more data from Germany this morning. We've got Bank of England's Carney also talking. Tomorrow is definitely about that OPEC meeting. We do have US inflation data. We've got US consumer confidence data as well into Wednesday. You know, plenty of stuff going on in here, but you got the second reading of US Q3 GDP data. You've got the trade balance numbers, of course, which have become more and more important given the trade war risk. And then, but perhaps definitely one of the key One of the key moments this week will be the Fed's President Powell talking on Wednesday, and we got the minutes from the Fed's meeting from 3 weeks ago on Thursday. And there's just some rumorings in here that Powell may want to use this meeting on Wednesday to start to reshape expectations about the rate hiking cycle in 2019. There's just some rumorings that the Fed perhaps when they hike in December in 2 weeks' time— or sorry, 3 weeks— yeah, in 2 weeks' time, when they hike in 2 weeks' time, which they most likely will, we're thinking that Powell's gonna start to begin the conversation this week about that being a dovish hike and that they'll hike in December to make it 4 for 2018, but then they're on pause as we go into 2019. So there's just some rumors that Powell might want to turn the conversation more dovish. So that's going to be very critical. And if we just go back to that oil chart, this is something that can play into the Fed's hands if they do want to slow down their cycle. It's because this, this dramatic— I mean, nobody saw this in terms of the speed and the size of the, of the move here on crude. But this is deflationary. You know, energy is an important component of the inflation basket. And when it when it plummets in such, you know, over— if it drops so far in such a short space of time, well, then, you know, you're going to start to see this feed through quite negatively from the inflation point of view. And that might be enough to give the Fed some breathing space to just put a pause on that rate hiking cycle. As I say that, I mean, let's just quickly go back to— where was that chart I was looking at? Um, well, yeah, well, I've got a Treasury chart here. Let's look, let's look at this. So one thing, because the Fed are maybe, maybe— and this is only investors speculating— maybe wanting to turn more dovish. Um, this is T-notes, and we've seen this kind of double top put in place here in Q4. And what's gone on in the last few weeks is quite interesting because the stock markets have continued to dump, as indeed last week was one of the worst weeks in this 7-week period of equity market weakness. And whilst that's been happening, T-notes, T-notes yields have been driving back lower. Of course, this is safe haven flow, uh, yields dropping, prices going up. And so yields on T-notes are now back at a 2-month low basically, and we're back looking at actually testing this 3% handle. That we broke above in September. Now because of this, we have seen the yield curve— let me get that chart— the yield curve, that's looking at the difference between the 10-year yield and the 2-year yield and the spread between the two. And actually this has stopped going down for now. I mean, we've seen a very pronounced downtrend on this for years. So when I say it stopped going down, I mean literally for the last few months it stopped going down, but it's still at the very bottom. And technically, of course, this is still definitely a downtrend. And what happened the last time the curve inverted— so an inverted yield curve is when the short end, the 2-year yield, is higher than the longer end, 10-year yield. And the last time that happened, in fact the last 7 times that happened, we then had a recession. So it's a great lead indicator towards a recession. At the moment, we've taken a breather on our kind of drive towards zero, but we'll keep an eye on that. So what's happened is that the safe haven flow has kind of halted that march higher for that 10-year yield. So if the Fed— this is the problem— if the Fed stay hawkish this week, this is going to be critical because 2-year yields will rise if the Fed stay hawkish this week. But whilst you've got such a negative investor sentiment, 10-year yields will not go up. They'll stay fairly anchored around that 3% point. And so if the Fed stay hawkish, we're really at risk of this curve tilting and becoming inverted. So really, we're looking for the Fed to turn more dovish for 2019 to avoid it. All right. What else is going on? Let's talk Theresa May. Of course, she signed off on the deal as expected on Sunday. No messing about. The meeting was 38 minutes, they signed on the dotted line, and then they all got out of there. Now, Theresa May— I mean, this was all exactly as expected, of course. So from a market reaction point of view, well, that hasn't been one. We knew this was going to happen. So cable here quite flat, which is still trading around the same levels we were a couple of weeks ago, basically just just sat in above this 128 handle effectively. So no real— I mean, slight mild upside this morning, but you can see it's nothing. So as expected, Theresa May did the deal. So of course, what happens now is she's got 2 weeks to sell it to the rest of Parliament. And how she's going to do that is she's going to go on a national tour where she's going to tour the country, and effectively she's going to sell it to the people. And then hope that the people put pressure on their MPs, and then hope that their MPs actually vote for this deal in Parliament when it gets voted on, and the date will be December 12th. She's also— speculation that she wants to have a TV debate with a certain Mr. Jezza, Jeremy Corbyn. So there's apparently going to be like a US presidential election style TV debate, and Theresa May wants to do this the day— the night before the Parliament vote. So her plan is to do a roadshow around the country. I mean, she should have done this for the general election, which she spectacularly messed up in 2017. But anyway, that's too late. So she's going to tour the country, sell this deal as the best deal for Britain. It's the best deal for— that's possibly going to be achievable. It's either It's either this deal or it's no Brexit or it's hard Brexit. And if we look at the kind of outcomes here, there's quite a good graphic. Where are we? Here it is. Let me just make this a little smaller. This is the situation. Parliament— so the less likely option, I would say, is Parliament approves it. So we're expecting Parliament to vote against this bill mid-December. If they do vote for it, fine. Great. UK formally exits the EU smoothly, and the transition period begins, okay, as we go into quarter 2 of 2019. All right, so that's if Theresa May's roadshow is successful and Parliament vote it through. Great, we're off. All right, unlikely. That's, that's not the least likely. Sorry, that's not the most likely. The most likely path is actually Parliament vote against it, at least to start with. The government then returns to the negotiating table to try and secure necessary concessions with the EU, but that's not possible. I mean, the EU have said that we're not interested. This is it. That, that deal's been done now. We're not going to change it. So most likely you might get a last-minute fudge, and most likely what will happen in the scenario that Parliament vote it down, you're going to get some financial market chaos and carnage. The pound's value will plummet, and it will set panic amongst the politicians, and they'll be forced back to Parliament to vote on it for a second time. And because hard— the hard Brexit reality and the market fallout that that will create will force politicians and force their hand, and they'll vote it through on the second time of asking. Or Article 50 gets extended. Okay, so that's the most likely scenario at this point. This is according to ING, I should say, but that's the most— that's the market consensus view. Or it gets voted down and they run out of time, and, or the EU are unwilling to negotiate, which is certainly a high possibility. So here we exit with no deal, all right, and we go to the World Trade Organization terms. There is a fourth scenario scenario. This is where lawmakers either vote for a snap election, but this would require a two-thirds majority of MPs to vote for that in Parliament, which is probably unlikely. Even less likely still would be lawmakers pushing the idea for a second referendum. The most likely would be Article 50 gets extended, somehow trying to buy more time to renegotiate, but the EU don't want to renegotiate, so That would be a bit of an uncertain pathway, to say the least. So at the moment, we're expecting the bill to fail first time round, the hard Brexit reality and the market chaos it creates to force politicians back some point in January to re-vote on the bill, and it gets through, and we have this move to Brexit and into the transition period. Okay, so keep an eye on Theresa as she trots around the country this week. Um, other stuff going on, Italy. So we've had some real positive moves on— look, check out Italian bonds this morning. This is the Italian bond market, 10-year prices. So 10-year bonds spiking higher. If we take this back on a slightly, uh, longer view, you can see this is the highest we've been now um, since back in September. So why is this happening? Well, Italy discussing reducing the 2019 deficit target. Uh, so this was that kind of surprise news, um, where— so it's 7:20— Italian coalition government are discussing reducing the 2019 deficit target to 2 to 2.1% from the original 2.4% target. Okay, so this would be a— well, be a positive step from Europe's point of view. The EU Commission will be happy with this, and markets like it. Whether the Italian people like this is a separate story, but another classic piece of evidence in my mind where ultimately democracy really gets trumped by financial markets. Um, you know, when the government voted in by the people on the mandate of increasing spending is unable to do so, is unable to deliver on that mandate that they got voted in for, they're unable to do that because, all right, pressure from the EU Commission, but basically because financial markets have forced their hand, and the cost of borrowing for Italy's government has gone up, which of course then makes their debt mountain look unsustainable, and the government have to back off. So again, Italy's government being controlled by financial markets, that's something we've seen happen repeatedly in the last decade. But anyway, certainly moves to the upside for Italian bonds this morning as you get a slight relief. If you check out the euro, Taken a little bit of a bid tone this morning off the back of this news as well. So moving up through that low point that we had middle of last week. So that's Italy. What else is going on? Some slightly amusing— well, not if you're munching, but some slightly amusing headlines coming out. Suggesting that— so Trump's Treasury Secretary Steven Mnuchin— so Trump apparently is now blaming him for the Fed's hiking cycle because Steven Mnuchin recommended to Trump that Jerome Powell become Fed chair. And Jerome Powell, of course, is about to hike for a fourth time this year, and Trump doesn't like that and has been tweeting against it. And Apparently now Mnuchin is being blamed for this, and apparently, um, is he— his job is now on the line. Um, so slightly amusing story unless you're Steven Mnuchin, where Trump now looking to get rid of him because he's blaming him for the Fed hiking. Um, so anyway, Pat, that is just quite interesting, this, because Powell's talking this week, and is he going to start to cave under this quite relentless political pressure. The Fed are supposed to be impartial, they're supposed to be independent, except Trump is doing his very best to make sure that's not the case. So I'm just getting the German IFO data through here. I'll just report on that in a second. So 102, which is just a touch below what was expected. This one's 105.4, 105.4 above the expected 105.3. Okay, so not bad, about in line, these German numbers. Um, so yeah, perhaps this puts a bit of— 98.7 for the business expectations. Um, yeah, puts a bit of pressure on Powell and another reason why he might turn dovish. Recent developments point to some loss of growth momentum. Okay, moving on. Um, just something else on that OPEC stuff. Saudi daily oil output said to surpass the record 11 million barrels a day. So whilst we're, you know, speculating, are OPEC and non-OPEC going to be cutting? Um, have they had enough of this collapse in price? Well, actually, at the moment, whilst they're talking about it, Saudi Arabia are still pumping at record levels. The US are pumping at record levels. So that is still going on. Another thing that happened over the weekend, Bitcoin, which trades over the weekend, taking another nosedive. We talked about this last week, but so just a little bit of an update. And if I show you the futures chart here, we're now down below $4,000. And indeed, the low we had this morning was down at $3,845. Quite extraordinary stuff. Bitcoin— this is Bitcoin futures chart I'm showing you. Actual Bitcoin itself touched down at $3,500. I mean, where is the bottom of this thing? Quite extraordinary, but still, still crypto getting hammered as we begin the final week of November. Right. That's pretty much everything I wanted to cover. So we've had the German IFO data. And what I'll do, let me just show you the, um, let me just show you the chart of this as I finish up. Um, yeah, so Bitcoin— Charlie's just telling me Bitcoin since the start of November, now that's 3 weeks, it's down 41%. Um, that's off the back of about a 70% drop before that in the in year-to-date terms. So let me just get this. Here we go. IFO number. So 102, basically in line with expected. But that does take us back to the worst levels we saw earlier on in the summer. So, you know, continuing drop here and loss of momentum, you might say, for the German economy. And if you look at a 5-year basis, this 102, quite— I mean, if you can do technical analysis on an IFO chart, I'm not sure whether you can or not, but 102 is quite an important level. We haven't really been below there since back in the start of 2017, really. So yeah, more evidence to suggest that they're getting a deceleration in German economic output as we hit year-end. Right, I'm going to leave it there, guys. So really important week, of course, the G20 summit. Sorry, I didn't even mention the G20 summit starts on Friday. And that'll be a key moment for this trade war risk, of course. So we're going to be talking about that in detail through the week as we approach Friday. So you've got the Fed maybe turning dovish. You've got key meetings between OPEC and non-OPEC countries. You've got the G20 summit where we may well get some positive or negative news flow from that trade war risk. I think this is the pivotal week for the rest of 2018. Other than that Brexit vote in Parliament on December the 12th. Okay, that's it for now, guys. Enjoy the session, enjoy the week. Thanks a lot.
More from Anthony


Inside the Biggest Banking Stories You Need to Know This Week (Anthropic, Diageo, Private Credit)


Inside the Biggest M&A Deals You Need to Know This Week (UniCredit, GameStop, eBay, Eli Lilly)







AI Breakthrough or Hype? Anthropic’s Claude Mythos, Tim Cook Steps Down & LIV Golf Collapse