How bad will it get for the stock market?
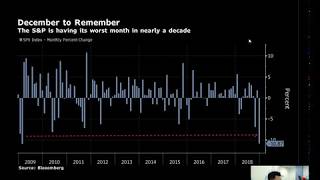
On December 21, 2018, markets show mild risk-off sentiment with the S&P 500 potentially heading toward 2,400, a historically rare move. The VIX has risen above 25 as trade tensions, Brexit, and stimulus withdrawal weigh on prices. Year-end illiquidity and quadruple witching could amplify swings through the holidays.
Chapters
Very good morning, Friday 21st of December. So the final briefing for us officially from the desk of the year. A couple things we're going to touch upon in the, the briefing. Obviously the, uh, the precarious nature of the general sentiment at the moment. So that's probably the main theme to discuss because it's not a great deal of, of kind of singular headlines that are really driving markets this morning. As you can see on the charts, we are mildly negative in the stock indices in the futures. We've kind of had a little bit of an uptick in gold, you can see in the top right, a bit more of renewed dollar weakness, but that's been a real seesaw performance over the last 24 hours post the FOMC. So it's kind of a mild feel to slight risk-off, nothing extreme by any nature. But I think really it's going to be— that's going to be the play today, is really watching a couple of these key products. There's obviously some near-term technical levels of significance. If it's the S&P, which we can just have a look at now and, and discuss a few different things. I mean, here we are and there's the fall that we had after the kind of less than dovish expected Fed. And the subsequent move there after that we saw in the low yesterday. And stretching this out onto a daily chart, kind of mark this up here of what was really important. I mean, this was during the Fed announcement. There were some really clearly defined levels that the market was kind of in that staggered selling fashion when you get those short fast money moves, people just looking for the first exit. And we kind of hit that and the initial April low, then obviously the, the year-to-date low with the sell-off that we had in, in early Feb of this year. And a break of that, you can see, has really opened the door to much more aggressive selling. Um, putting this in context as well of, you know, how bad is this sell-off? Well, the S&P 500 is having its worst month in nearly a decade. You can see here, you've really got to go back to the the depths of the financial crisis era of when we were, we were last seeing this. I mean, not to forget though, I mean, this December, if you remember, it was kind of only a month or two before that when Lehman collapsed. So we were still— that was pretty much the worst point of the equity sell-off back then. So haven't been there for a long time, and, and certainly then as a byproduct of this renewed market movement and obviously multiple factors from a news basis that are driving these prices, then the VIX has risen. To give you a bit of a visual representation of where we are, and obviously 20 is often referred to as the kind of the line in the sand, if you like, of what then starts to move into a more fearful territory. You remember we had the big initiation of the equity sell-off and the kind of slump in the FANG names, and that was in the October-November period. We kind of got above there, but we've kind of pushed on beyond 25 now, which again puts us up into the realms of where we were right at the beginning of the year when we had that pretty ferocious sell-off at the time. So I don't think any of these are too surprising. It is this combination of, you know, the, the narrative of global growth slowing, Brexit dragging on, risk of a no deal, the trade war kind of raging on, stimulus being withdrawn, the yield curve indicative then of an impending recession. There's just a whole plethora of bad news out there at the moment, so, you know, it hardly feels like Christmas at the moment for markets, that is. So inherently a lot of the question mark now is, and certainly the last couple of days of the year, is, is this the bottom? Have we, have we seen the worst of the selling? Well, a couple of things here. Statistically speaking, it's been 91 days since the, since the top that we had, and that's about three-quarters of the length of a typical correction. If we go back to every correction that's happened, come in with a data set, but it goes back many, many years. So we're kind of Still got a little bit longer to run, but the end is almost in sight. If you were looking at the historical precedence of how long do these phases of equity movement to the downside into this correction, and to almost, you know, what's to say we don't go to bear market territory, but those moves. The other thing here, of course, is, you know, as I said, the technical breach being so important of that previous year-to-date low has exacerbated the selling and I was reading a note from JP Morgan this morning, and they were talking about this idea of a, of a dual vacuum of lots of negative news accompanied by the problem of the time of the year, which is a very illiquid time. And so therefore, it's kind of a dual force that exacerbates price movement. So a couple of people, not them specifically, but other banks that I've read Quite a few are identifying 2400 as an area of where, you know, if the, if the market gets that mindset of which we've seen at times during this week when it kind of becomes almost a snowball effect and more and more selling pressure comes in and the automated machines start hitting the price activity which propels even more selling and that kind of capitulation, then, you know, 2400 I think is definitely within the realms of of an area that we could get to, um, even today. I mean, looking at the speed in which we've moved, I'm not saying we are going to get down there, but if you look at the areas here, I can see why a number of people here on the left-hand side are looking at that. That was kind of the 2017 peak. We came off there. I mean, not forgetting this was all-time record highs initially in March 2017 when we hit it. We then found we resistance again through pretty much the month of May before the break, and then the subsequent support in July before then the bigger move higher. So, you know, there was a real period here of pretty much 6 or 7 months where that 2400 was kind of the big, the big number. So yeah, if we went any further, I'd say that would be a real key area where if we were to go down, A, as a target for that persistent selling pressure, where a lot of people, I think, would want to come out of that trade. And then so as a net default, you probably get a pretty strong bounce from there. That's not to say though that, you know, we're going to get there. There's another— to kind of talk the other side, and I did quite enjoy this graphic from the FT this morning, uh, still keeping the faith that Saint Nicholas is gonna come back for the late show, but for the S&P 500, it would need to stage a historic rally in order to erase its year-to-date decline. So the 6.65% rally needed to see the S&P 500 finish at least flat for the year would, would rank, if that did materialize, as one of the top 3 rallies for this time of year on record. So it's got to be a real late-game performance here if it's going to pull it out the bag to finish flat for the year. A couple of things then to have a look at on these other charts is beyond the S&P. I mean, if we're looking at a slightly more near-term profile of the price action, then yeah, we were in a bit of a period of consolidation really during the overnight Asia-Pacific session. I guess the, the risk here are kind of retests down at the, the lower bound levels. And as we have seen, I think a lot of this is about just being patient and waiting really for the North American entrance, i.e., London about 11:30, 12 o'clock, when we start to see a little bit of volume momentum pick up. And then for the open on Wall Street, a couple of data points we'll get to in a second as well that are coming out throughout the day. Looking at gold, as I said, it had been seeing a little bit of a lift. It's just pared back just a touch here more recently. Finding a bit of resistance at the, the overnight high, which was the Asia-Pacific session, uh, just around this point here. You can see just bounced off that to the tick on that recent rise. Any upside movement, if we were to see that renewed selling pressure in the equity market, then I'd be looking up at that 1270.3 level, uh, in terms of— that was yesterday's high. Looking on a daily continuation Uh, you can see we're at quite an interesting level again in, in, in gold. This is just a chart I've had marked up throughout, throughout the week really, and 1260.6 here in the futures. We're sitting just above that level at the moment, but you can see here that acted as a significant price point on prior occasions going through 2017 and '18. And so does it use that as a bit of a floor here to— again, if we're going to push higher if that equity sell-off did materialize, then, you know, there's a decent bit of clean air, I'd say, to the upside for further gains here. On the flip reverse though, should, should we get a bit of a bounce, then certainly if we continue lower, be looking down at the, again, the late Asia low. So this is kind of the Asian range, if you like, that we're trading right in the midpoint of at the moment. But that was also the high point from Wednesday session as well. So that 1262 would be, uh, probably a significant level of support. That would open up then a breakdown to pivot under those circumstances. Elsewhere, oil's pretty quiet, uh, not too much movement really, but this does hold quite a key catalyst really if you're going to identify if it's going to be a risk-based sentiment type session rather than a specific headline or data-driven one. Then I think monitoring really the yen as well as gold for that kind of perception of risk appetite, but also crude. Crude, as we know, has had a tough time of it this week. We've obviously got through some real key levels here on the downside. We'll just wait for my chart to populate. But now having breached more significantly that 50 level and then that 49, which was around the October 17 low, really quick rundown to that 4580. So what's quite interesting here is the way that price has been moving. If I just use a rectangle here, we kind of had that consolidation after we had that really huge run lower in a very quick fashion, and then the break, run lower, consolidation. So it will be interesting to see whether, you know, this is obviously a key area here where we are at the moment, this kind of band here I've got marked up from the low print of just the other day, and then going back to August, the summer of '17. Because if breached there, then I don't really see any reason why we wouldn't push on through 45, and then, you know, the target starts scaling back down to probably 43.68 and then 42 handle. So, you know, the kind of the way that this price is going is kind of— is it lining up for that next breach? And if you were looking for that sign for the equity trade, that correlation has been pretty tight of late. So something else to watch as well. And quite the vice versa, if oil does bounce off that point, well, I'd probably be a lesser conviction then that you're going to see that equity sell-off that we've been talking about. Um, talking of, uh, the risks out there, obviously this was one of the headlines from yesterday, and it's been quite amazing actually since that Huawei story where China's really kind of ramped up actually what had been quite a general passive approach to the response to Donald Trump and the US administration. But hackers yesterday, it was reported, were working on behalf of the Chinese Ministry of State Security, breached networks of several technology firms in the, in the States and used the access to hack into clients' computers. Was what was in circulation yesterday. And again, another negative story to just weigh on prices. But the other thing that's happened as well is overnight, you probably would have read, you've had Mattis, the US Defense Secretary, he's basically resigned. And in his resignation letter, he's very much called out Donald Trump, talking about the fact that they can't really work together because of their misalignment of the relationships that they have with their alliances. A lot of people looking at this as Mattis probably being one of the only real remaining— they kind of refer to it as the adults in the room. And so again, it opens up Pandora's box where Trump is just there with a whole room full of yes-men. So what Trump wants, Trump gets. And that is quite worrying from a financial markets point of view, because what creates price stability, of course, is continuity, more certainty, you know, transparency, everything of which Trump is the complete opposite of. So again, you know, we're not short of risk factors at the moment. And I think this actually is a fairly significant thing that's developed here. On that point, one of the things that Bloomberg always do every year— I'm not going to go into this in detail, but I'm going to pop the link into the chat room for you guys to have a read. It's done with a little bit of a pinch of salt, of course, but Bloomberg always put together at the end of the year kind of a look ahead for 2019 and and what could be a flashpoint to watch from a geopolitical point of view. And, and obviously geopolitics is absolutely at the core of financial markets and certainly will be throughout 2019. So if you scroll through, it's got things like a new arms race, Russia, what would be the worst case, what are the risk assessments around these things developing. Trade wars, wars, wars. You know, this is when we start getting into that black swan type territory. Iran restarts nuclear fuel production, prompting a rapid escalation. Tehran tries to block the Straits of Hormuz, which you remember has 30% of all of the seaborne traffic in oil. Well, there comes your $100 oil for Saudi to deliver their finances for 2019. North Korea, does the peace agreement break down? Russia, Eastern Ukraine. And then of course, what I did like about this Bloomberg article was of all these different things, European disunion, that's obviously a key risk with the expected slowdown for the eurozone. Trump's got his own category, which I thought was pretty funny, but it's probably true. Trump probably does deserve his own category. And as I said, with the the conveyor belt of his senior team changing so much and the replacements being, as I said, all the more who he can kind of persuade or at least manipulate to do as he says. And as we've seen, that can be very much driven for political gains in that sense, which is not always the right moves for the economy in the long term. I should say. Okay, so I mean, that's pretty much the wrap. I mean, as I said, there's not really one single story that I'd say is, is really driving things. I mean, from a Brexit point of view, these are the headlines this morning, and really this is just in the aftermath of those comments, of course, that we had from Amber Rudd, um, the cabinet official from yesterday who brought about one of the first more higher-ranking officials in the Tory party to talk about this idea of potentially open to a second referendum. And this article is kind of suggesting the same thing, that apparently behind closed doors there is this secret plan of where potentially, um, we could have a second referendum, essentially. So other than that, let's have a look at the calendar for today. We do have some UK data forthcoming, so that is GDP but, you know, think about the timings. We're about to go into Q1, so this is the last reading of Q3. So by default then, I would not be looking for any real reaction from this. We've seen Q3 data multiple times. Um, public sector net borrowing, potentially quite interesting. Uh, so yeah, 9:30, we'll keep an eye on the pound nonetheless. But then really, I think as per usual, it's going to be US geared session. I did also hear the squawk. They probably got it on the calendar here. Uh, yeah, it is quadruple witching as well. So if you wanted to throw in another reason for elevated volatility into a seasonally generally lower volume time of year, yeah, I'm just gonna say you have your wits about you later on. And that's why I say that if there is a sell-off we could hit that 2400. I don't think it would be a problem for the S&P given these, these multiple factors. What I'll do is I'll post in for anyone who doesn't understand what quadruple witching is, then I'll put an article in the chat room that explains it in more detail. Essentially, it's the expirations of various different index and single stock futures and options, and it all happens at exactly the same time, which elevates volatility at that point. But otherwise, in the US session, core PCE, you also get the final Q3 GDP from the US. So the final GDP is, is probably unlikely to be revised dramatically. I guess the core PCE could be quite interesting in a sense, but this is final again. Again, and with US economic data, I'd say going forward what's going to be key to watch is, and as we've seen earlier in the week, if we get a really weak number, because the Fed, albeit the trajectory is dovish, you know, they are committed to doing a couple more rate hikes going forward. So one that they just did and then two more in 2019. So the more dramatic the slowdown in economic activity, the more the Fed have got to shift away and become even more dovish. So economic data does take on a new realm of importance actually going into the early part of 2019 for sure. Um, just finally, oil I just saw was just coming down again. I saw it flash red, so just keep an eye on that. Still remaining fairly fragile at the moment in terms of the lower bound levels. Okay, so that's it. I will wish you all a good session ahead. Um, I'll probably try to deliver a briefing or two over the Christmas or New Year period from home, so you've not got a shot of me as yet. I'll be— if there's anything that obviously happens big in the market over the Christmas period, I will jump on, do a recording, and then probably post it on YouTube. So keep you guys fully informed. If you are trading over the Christmas New Year period, what my, my advice to you would probably be just chill out. We've had an amazing 2018, it's been incredibly volatile, there's been lots of news-driven events. 2019 Q1 is set to be phenomenal for fundamentals, and so I would just get some rest, let your body and your mind just relax, and then come back and hit it. Obviously, if something unexpected does happen, it's a very illiquid time of year which could promote then large exaggerated moves in the market, then sure, maybe switch on your screens and have a look and potentially trade. But otherwise, it's very important, I think, you know, the whole reason, especially from a proprietary trading point of view, you're doing this is to earn yourselves these types of breaks and enjoy it with your family and your loved ones. So yeah, come back fighting 2019. The show's just begun. The volatility, it looks like, is only going to get more. So yeah, thank you very much. For those that follow us as well on social media, appreciate you taking the time to watch our videos. Much more to come in 2019, so thank you very much and have a fantastic Christmas and a New Year. Thank you.
More from Anthony


Inside the Biggest Banking Stories You Need to Know This Week (Anthropic, Diageo, Private Credit)


Inside the Biggest M&A Deals You Need to Know This Week (UniCredit, GameStop, eBay, Eli Lilly)







AI Breakthrough or Hype? Anthropic’s Claude Mythos, Tim Cook Steps Down & LIV Golf Collapse