*LIVE* US Non-Farm Payrolls - 3rd Feb 2023
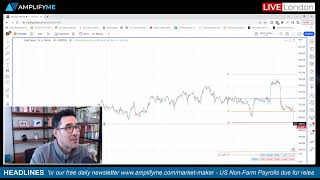
Anthony Cheung breaks down the February 3, 2023 US jobs report live as it drops: 517k payrolls added, far above the 185k median forecast, with unemployment at 3.4%. Markets sold off across stocks, bonds, and currencies, reading the hot labor data as a signal the Fed will keep rates higher for longer.
Chapters
Okay, hello and welcome. Just gonna get everything up and running. We'll give it a minute for everyone to onboard, so to speak. So hope you are well. We haven't done a live session like this in a while, thought it was a little bit overdue, so absolutely happy to jump back on and and hopefully give you a bit of a prep for NFP coming up momentarily. So yeah, we'll give it a minute and then I'll get into a full rundown. So yeah, welcome, welcome. Hope everyone is well. Happy Friday. I'll give it 60 more seconds and then I'm going to just jump, going to dive right in and let's talk about Nonfarm Payrolls coming up. If you are watching this on social, there should be a chat function. So feel free to drop me a message. I know we tend to get some of our regular followers tuning in, so it'd be great to hear from you. Kevin, Kavi, Rav, hello, hope you are well. Just for the benefit of anyone who's not actually joined us on a session like this before, I'm going to try and keep this to a fairly introductory level in some respects because I, I'm sure a lot of you have probably never even watched non-farm payrolls live, but I always think it's a really great learning opportunity to watch this kind of stuff as it happens. There's no better way than, you know, kind of learning this stuff in theory— what is it, what does it mean, how does it plug into things like monetary policy and subsequently market reaction and movements. But then to just see it play out and watch it in real time, there's no substitute for that kind of screen time. So hopefully, yeah, we can, we can watch it all together. I'll give you a quick, you know, run-through of what to look out for. We'll have a look at the charts. I've got a couple in front of me here at the moment. So I've got EURUSD top left, Cable center top, Gold on the right, and then we've got the US 10-year, NASDAQ 100, and the S&P 500. Um, so yeah, Antonio, I hope you're well. Okay, hi everyone in the chat. Cool. Well, look, let's get cracking and let's start talking about what's to come. So I'm going to switch over my screen and let's just talk about the economic calendar and what we're looking out for just from a, I guess, release perspective. Because if you're not used to looking at non-farm payrolls, there is a great deal of information to tackle Nonfarm payrolls is a multi-faceted event, although the market and what you'll read in headlines and certainly how the market will react in its initial knee-jerk fashion will be very much dominated by the headline change in nonfarm payrolls. That is here, 185,000. Then you've got things like private payrolls, manufacturing, government payrolls, the unemployment rate, average hourly earnings. The list goes on. Now, Couple things just on the calendar perspective. Whenever you get a bunch of numbers like this, the really important thing to do in preparation is to identify, well, what truly is the market going to lock onto that's going to determine the subsequent reaction when the information comes out? Now, the headline ultimately will be indicative of the first reaction. A lot of that is built on algorithms, so computerized trading systems which are basically plugged into the API at the BLS. Soon as the data point hits, it's just a fixed binary formula that will hit depending on how out of line the number itself is as to what the subsequent machine reaction might be. So a key component to understand there, of course, is the ranges. And when I mean ranges, I'm talking about here, so So you've got a low-end range of 125,000. So, i.e., these are the most pessimistic banks on the street and what it is that they're expecting this number to come out today. So 125,000. So they're below the median consensus. Then the more bullish point of view, 305,000. It really doesn't matter which investment bank is at the top or bottom. The general distribution follows a normal bell-shaped curve. So it's all clustered around the median. But to identify the, the nature of how violently the market might react, it's very important to understand the fringes, if you like, of what define the, the least likely end scenario on both a downside and upside surprise. Ultimately, the larger the standard deviation away from what the market is expecting, the bigger the reaction that we could expect on the initial move in markets. The other thing here is about, okay, so if you plug in now the macro context, obviously something that's really important here is inflation. You know, when you talk about central banks at the moment, the whole continuous conversation is about inflation. That's what really drives their decision-making at the moment. We've had obviously 3 of the big central banks this week: the Fed, the ECB, and the Bank of England. Now, it does mean that the headline change in jobs at 185,000— this is what that number looks like over the course of the last 12 months. So all of the last 12 reports, and you can see here there's been a graduating downward trend, fairly consistent, and 185 would just continue that trend. What the market's probably going to latch onto more so is going to be what are these average, um, earnings data points. And these are really quite indicative of then once you hear that number, the market might pop one way or the other, but I would say very unlikely that you could commit to any type of trade with any level of conviction until really you've been able to hear and digest these numbers. These are ultimately very key. Inflation, of course, in the US has been decreasing. Uh, Jerome Powell, the Fed chair, said in the Fed meeting 2 days ago that they can say now for the first time that the disinflationary process has started. Um, so You know, inflation going down is not too much of a surprise, but I guess how much is it going down, or is it not going down? And in fact, wages, if they come in higher than expected, what you could see then is certainly reversal in equities, which have been very well bid generally since the FOMC meeting on Wednesday. I'd say if anything, the US equity market here is a little bit ripe for a decent downside reaction for that to happen, um, you probably want to see that wage number come in over and above the high end of expectation on the month-to-month reading. That would be something in the region of 0.6. It's expected at 0.3%. You'd also expect the 10-year to drop as yields pop higher, and the dollar in that scenario would likely strengthen quite aggressively, and thus EURUSD and cable would come down to retest. You can see here that previous morning low, which was yesterday quite a key support level in the euro, top left, and cable retesting the morning's lows. On the flip side, if inflation is indicative of what average hourly earnings come in low, and low would be bottom end of the range 0.1, so if it came in flat month on month or even negative, well then certainly you could get another push up, squeeze in equities to retest the overnight highs that were seen prior to the close on Wall Street after we saw a bit of a pullback after those weak mega-cap tech earnings we had. Remember, Alphabet, Amazon, Apple all missed on their expectations. Um, okay, so a few other things just to have a look at, and what I'll do is I'll turn the squawk on. We'll be able to listen to all the information as it comes out whilst we're looking at the charts in real time. So switching over again. Um, this is essentially the data points that have come out as a prelude to non-farm payrolls. A real key thing about understanding how markets are going to react to the release of fixed scheduled information is how are markets positioned. Now, how do you determine that? Well, you can look at the charts and you can see, as I was saying, the equities are quite overextended given some of the information that we've had and the move more broadly we've had since year to date, which has been a decent equity performance. Performance, but definitely bolstered by the Fed. So we're pretty high in the context of recent market trade, but also a lot of the expectation is derived from how did these other employment indicators come out that would measure around the same survey period of which this Nonfarm Payrolls report is gathered by the Bureau of Labor Statistics, the BLS. So here we can look at things like Challenger job cuts, So generally have been a positive. Number of corporate layoffs jumped in January from 43,000. Well, I'm not sure that's a positive. I'm not sure why they've written that, but layoffs have been going up. And obviously that's been a common theme that we've seen, particularly with tech stocks trimming the fat, if you like. And we've heard that from all those big tech names that we've heard report this week, from Microsoft through to Meta. And Meta, of course, exploded after market last night. Big part of that reducing their cost base given the large-scale job cuts that they've enacted. So job cuts generally have been increasing. Initial jobless claims, the last jobless claims release came in a bit below expected. Again, I don't really think this is really going to move the needle as far as people's consideration for what the Fed might do. Certainly much more on the inflation metric, which does render some of this quite redundant if you follow that, that chain of thinking. The other things you'd look at are you obviously get the ISM, the Manufacturing Service PMI data points, and within that are components of which one of the measurements is employment. So the others would be things like prices paid, inventory, these types of measurements to see a granular breakdown of the overall PMI figure. The employment one has been negative for manufacturing, the subindex. Came in slightly worse than the prior month and in contraction, so below 50 at 47.4. And the services number doesn't actually come out until— well, let's see, service number will release on Friday, January 6th. It can be easily— okay, so I think maybe some of this is a bit dated, so I'll just talk through this as just a— rather than the numbers, as in the matter of fact of how to kind of prepare for these things in future. Other measurements you can look at, the one big one is ADP. So if we just quickly jump out of here, come back to the labor statistic and go down to ADP, you can see ADP came here 106,000 earlier in the week, um, and that was against market consensus of 178,000. It was the lowest reading since January of 2021. So we had a particularly bad ADP number. And bad, um, in a sense actually means fairly, fairly good if you're looking at equities, for example, because it means then the Fed are probably less likely to want to aggressively keep rates higher, or at least continue hiking at the pace that they had. Remember, they downshifted to 25 basis points in this meeting for the first time. And so Yeah, ADP, you can see here, undershot quite a bit in terms of a drop from the prior month's reading and also was firmly below market expectations. Um, one of the things that was noted here was though to be aware of that the soft January reference week was when the US was hit with extreme weather. So this is a really important point actually, and just before we listen out for the numbers, because If it's extreme weather impacted, that means that there's probably not an underlying trend, and thus you wouldn't really read too much into one figure, if that makes sense. All right, I'm going to switch the squawk on. The release will be coming out any moment. We'll listen in to the numbers as they hit, and then I'll try and talk you through what's going on and how the market is reacting. So you can see the charts on my screen. I'll make them a little bit bigger as I talk about each one as we go through in a moment.
Expected at 185,000. The unemployment rate, that's 3.4% below the expected of 3.6%. The prior, that's revised higher to 260,000. In terms of the earnings components, month to month, that's in line at 0.3%. Year over year, that's 4.4%, above the expected 4.3%. In terms of the breakdown, labor force participation, that rises to 62.
Okay, so just to be clear of what we've heard here, the actual headline figure is way higher than expected at 517,000. The average hourly earnings are relatively in line. So here you've had an initial movement of equities down. So this is a negative for stocks because the jobs number is much higher. So just focusing on that alone, the reason for the downward move is because then it kind of strengthens the idea that labor market is solid, so therefore can withstand then a higher interest rate environment from the central bank if they deem then inflation is still proving more durable. And so equity valuations typically don't like a higher rate environment, particularly given the market positioning I was talking about. You can see the NASDAQ and S&P initial reaction is down, as is T-notes, as is gold, as is the currency pairs. So if you look at all of these charts, you've got FX pairs, gold, commodities, and US stocks. They're all going down. And so it's a uniform move based on this idea then that, you know, rates could stay technically higher. I'm not saying that the Fed will do that. That's just the initial assumption here of what's just come out. If you actually look at the, the rest of the numbers, um, just while I've got them in front of me, the average hourly earnings on a month-on-month was 0.3%, so it's in line with expectations. The year-on-year, 4.4%, 0.1% higher than expected. The unemployment rate was a little bit lower, 3.4% against 3.6% expected. So again, that's an incredibly high payroll headline because if you remember the range that we were looking at, if I just quickly jump over my screens to here, the headline top end of range. Remember, we were expecting 185. The top end was 305. And if we go back then to what the previous payroll numbers were, the last time we printed up at this high, you'd have to go back to last summer, July 2022. So you can see this is way over and above. So one of the things that's sensible to do now in this scenario is to jump on the BLS website, which I can do now, and start actually delving into the report with what, what has created. So one of the things that's really important to do when you're trading or you're an analyst is when you see such a stark outlier, my mind thinks, well, why? How did that happen? How can analysts, economists on their estimate be so off-piste? And therefore, is there a reason? Because if it's an anomaly and there's an explainable one-time effect, well, then actually there could be an opportunity to reverse this market after the initial pop that we've seen. So let's just— well, I'll leave it on the charts for one second. I'll quickly grab the BLS report and let's have a look. So, so let me talk you through then. So this is the Bureau of Labor Statistics report. This is the, the website. So if you just go on to new releases, you can click on that. This is the actual kind of genuine report that comes out. So you can see the headline number here. And generally what I do in this case is just have a very quick scan through all of this to see, well, why and what justified such a pop in those numbers. Um, you can see here, job growth was widespread in January, led by gains in leisure, hospitality, professional business services, and healthcare. Employment also increased in the government, and that partially reflecting the return of workers from a strike. You know, so that's— so things like this are quite key. It's like, well, if it's workers returning from a strike, It's just a quirk of how this data is gathered. It's not new people joining the workforce. It's ultimately people just coming back who were already employed but were on strike. And the way that they get measured, kind of, they've fallen out and fallen back in. So not as good a scenario as if people were getting fresh, genuine new employment, uh, in that situation. But obviously this comes in the context that a lot of people still trying to determine in the US are we going to have a recession? If so, when? How deep? So forth. But the market, you know, the jobs market remains pretty robust. Actually, I actually think that this is— I know the initial reactions have been obviously the dollar's been, been bolstered by this, and that's weighed on EURUSD and cable. They have both extended on some of the downward move through the break of those technical support levels we were just having a look at. You can see here that euro probably now as an area of support just on that low that we had overnight in the Tuesday, go Wednesday session. Cable already breaking through that morning low, just helping add a bit more weight. But yeah, are the Fed going— is this— will this change what the Fed are going to do? I don't really think so, just given the proximity of the Fed event. I actually think if anything it's not a bad situation for stocks at least, because even though they've come off a little bit, the move's been relatively contained. But if the employment market is going to remain robust and inflation continues to come down and the Fed continue to downshift and, and do indeed get close to then their terminal rate, the peak of the interest rate cycle, well then if we don't have a recession, we have a soft landing, Isn't that good for stocks? So yeah, it's interesting to see how, how it will play out. And really, a lot of the time you've got to wait until the end of the day to see how the dust settles. To, you know, there's two ways of looking at this market, right? You can be an intraday day trader, and obviously, you know, you're kind of snap in quite aggressive. A number like that certainly gives a fairly clean cross-asset directional trade, everything down in that sense. So it's more about the execution and getting hold of that move. But then there's the other side of it where if you're more, um, an investor or looking at this from a fund manager's perspective, um, actually what is a negative short term for prices, certainly for equities as I described, I actually think could be actually a mark positive for the reasons I explained. Alright, so, uh, any questions at all while I am here? And while I am here online live, I know many of you probably are already part of the community, but I'm just going to share the link for our daily newsletter. Please do check it out if you haven't already done so. And also, if you are a student and you have not yet taken part in our Finance Accelerator simulation sponsored by our partner Morgan Stanley, who very kindly is driving our mission to go out there and just attract students from all corners of the world, all different walks of life, to really identify talent from, from everywhere and anywhere. So regardless of your background, you certainly don't have to be an econ student or anything like that. Um, if you're into experimenting on a potential career in trading or asset management, 100%, you should give this a go. Who knows, it might be something you're genuinely gifted at, and if so, we have the potential to fast-track you to banks like Morgan Stanley and many others. So definitely worth checking out. Uh, all right, any questions at all before I wrap it up? Okay, I'll stay on for another few minutes just in case there is anything anyone would like to ask. Otherwise, yeah, hopefully that was— yeah, quite a lot of action to digest, of course, but hopefully it all made sense and that was useful. Yeah, equity is just bouncing a little bit now. The S&P, uh, you can see here it blipped lower. It's already retraced almost two-thirds of that move on the initial move lower. Uh, T-notes still remaining a little bit firmer. I probably would expect that, to be honest, because if you look at the US 10-year, we're pretty much scratch of where we were prior to the FOMC announcement. So the FOMC announcement generally was deemed to be, and certainly in the press, a little bit more on the dovish side of things. They obviously hiked, but they went for that smaller 25 bps clip. Markets responded very positively. Talk of disinflation, lack of really pushing back against markets pricing about what the Fed are going to do in future, which is that rates would peak in March, um, and a subsequent 50% easing cycle through the second half of the year. He didn't push back against that. That explains all the rationale why stocks were on fire post that period of the Fed announcement. But here we are, we've reversed that. And I think that's pretty fair, to be honest. I mean, this number's rock solid on the job creation numbers, certainly way more than expected. Does it change, uh, the Fed thinking? I don't think a great deal. The average hourly earnings, remember, were in line, so we're just exactly where we were all things being equal. So yeah, I think it's a decent move as far as the 10-year is concerned, but I think in context of the last 20 or 48-hour price action, it's not that big a move, to be honest. Euro-wise, obviously, um, you had had a bit of euro-dollar upside, a bit of divergence play. Obviously the Fed talking a little bit more dovish, but the ECB stand— standing put and talking about, look, we're going to hike again by a similar margin in March, and then we're going to review it thereafter. So that, that gave the euro a bump above 1.10 yesterday, but we've come back below there now. And again, just breaking through some of these technical levels of support from the last 2 days, just helping assist a bit of a downward momentum. But yeah, equities though, not, not so much so at this point. Let's have a quick look at gold. Um, probably have to zoom the chart out a little bit to see any significant levels coming up. Um, kind of where we are at the moment really would start to bring in the high from the 11th of Jan. So yeah, a bit of a breakout in gold at the moment below, um, some key levels of late really. The last trading day of, of January, which was some of the lower bound of the price action in mid to late Jan, has been taken out, as is the S2 on the pivot levels. So Yeah, a little bit more punchy there, but that would fit obviously in tandem with the yield move and the dollar appreciation. So this is why you can see the move is a little bit more clean almost. You can see the dollar still pushing up a bit as a yield. So EURUSD cable, the 10-year still pushing down, equities less so. So again, that's where, again, you've got to pick your spots and pick your product and your asset type because they will react slightly different— differently. So you have that uniform move, and then you've had equities that now have started to bounce and are less bought into that narrative about a kind of more hawkish reaction. All right, I'm going to wrap it up there. Thanks very much, everyone. Um, once again, I've dropped the link into the the chat for the newsletter, the Finance Accelerator. Would love to have you on board. I think we're even running a Finance Accelerator, um, later today, um, at 3 PM. So if you haven't got anything going on, jump in and give it a go. I'm sure you'll enjoy it, and I'll probably see you there. All right, take care. See you next time.
More from Anthony


Inside the Biggest Banking Stories You Need to Know This Week (Anthropic, Diageo, Private Credit)


Inside the Biggest M&A Deals You Need to Know This Week (UniCredit, GameStop, eBay, Eli Lilly)







AI Breakthrough or Hype? Anthropic’s Claude Mythos, Tim Cook Steps Down & LIV Golf Collapse