May under pressure as Brexit plan called into question
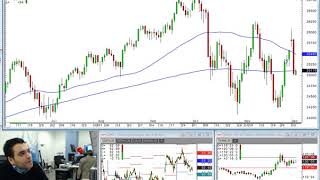
Markets dropped 3% as the Fed turned dovish, the US-China trade truce wobbled, and a death-cross loomed on charts. Theresa May faced historic parliamentary defeats over Brexit while sterling swung wildly. Oil inventories surprised higher, Australian GDP missed, and US markets closed for George H.W. Bush's funeral.
Chapters
Okay, so very good morning everyone. It is the 5th of December and I'll be covering the brief today. Two main topics we're going to be discussing today. One was sort of a quite large equity market sell-off yesterday and discussing some of the reasonings behind that. And then secondly, looking at quite a major defeat seen by Theresa May over this Brexit deal and sort of the implications that may have going forward. So To start off, let's have a quick look at the charts and let's start off with the equity market. And I think it's becoming quite an interesting space to be watching. It's been quite a year for equity trading and risk as well, starting off sort of in February after one of the lowest volatile years we've seen in history. Massive sell-off seen due to inflationary fears, having recovered, made new all-time highs, another fall. And this recent fall we saw yesterday looking pretty menacing over here. we were to have a look at the move lower, you know, 3% on the S&P, similarly seen 3% move lower in the Dow Jones and another 3% in the Nasdaq as well. So quite a hefty move lower, which is nothing new in 2018. But putting into some context, this is becoming quite worrying. We had the Fed or Jerome Powell turn quite dovish recently, saying that we're very near the neutral rate and data dependency, etc. So quite a stark contrast to being a long way off the neutral rates. That dovish commentary plus the G20 summit where there seemed to be some positivity between Donald J. Trump and President Xi allowing the equity market to lift higher. So it seemed like a perfect storm was brewing. Dovish Fed, trade wars easing, and the market gapped higher. Came up to test the top of this range. But yes, there is some doubts over the trade wars. If I just flick across to the 9 reasons for the sell-off, one of the main ones is, you know, there's the truce between China and the US looking a little bit more fragile than initially thought, um, allowing basically the equity market to come under some pressure at the top of that range. Um, but In essence, we're still seeing some developments. China is taking positive steps towards ending this. So, almost coming to the point where they're admitting about intellectual property theft and trying to negate that going forward. And we got the Davos Fed. But despite that, Donald Trump's continued hawkishness, saying it's real deal or no deal. Sounding very much like a Brexiteer here. Um, so people getting a little bit worried here where there is positivity. Instead of building on that, him turning super hawkish on that front, uh, just getting investors a little bit nervous. And even if you look at Navarro, who is a China hawk, he's saying it's premature to lose faith in US and China talks. Now, on the face of it, that doesn't seem too bad, and in fact could be interpreted as positive, but I don't know, reading between the lines, premature to lose faith in the US-China talks, this It just doesn't sound very optimistic, which you would expect from him, but then coupling Trump basically making China look down the barrel of the gun, saying, "You have 90 days to make a deal with us." China saying, "Fine, we're back at the negotiation tables. We are looking to make positive steps towards this." And then Donald Trump harking on on Twitter about "real deal or no deal." Get to the negotiation table and get off Twitter, and that may help this deal go through. But his continued hawkishness is really playing on the markets to the point where it is one of the, one of the main factors, I'd say, for this recent sell-off in the equity market. But I don't think it's as simple as that because we have had some technical indicators as well. So having a look at your 200-day and your 50-day moving average, it looks like we're coming up to a cross here. So that would then be a death cross, which is quite a strong technical indicator for further sell-offs. So if you have a quantitative trend following strategy, or if you're a fund manager, trend-following fund manager, a cross here would then initiate signals for you to start selling parts of your portfolio. So this cross would definitely lead to further volatility, undoubtedly, where funds who have been in this trade following the golden cross, which we last saw— if we go back, sort of Q2, Q1 2016. So this was the sell-off we saw back in 2016 where we were worried about a hard China landing and oil prices plummeting down to about $26. But after we got over that, we saw the Asian markets start to recover. We had this, this cross where the 50-day moving average crossed back above being a golden cross. And if you look at how the market has performed since, absolutely stellar returns here. It's going from— let's just take it simply from the cross to where the cross is. The market is up 40% since then. So a lot of people entering the market on the back of that golden cross. If we look at it historically, we probably saw another cross back in 2000. So 2011, when the European debt crisis was escalating, we thought the European area was going to end, um, as a whole or implode. We saw equity markets globally take a downturn, and you can see that the 50-day moving average crossed below the 200-day moving average, and that led to some volatility for all almost 6 months here, only for then the market to recover, giving us a golden cross, a buy opportunity, and that cross within itself leading to returns of— what's that number? 65%. So I have my glasses on me. Yeah, 65%. So, you know, these technical indicators are not really being watched by intraday traders. These are your asset managers, wealth managers, and money managers looking at these sort of longer time frame death crosses and golden crosses. So, you know, with, with that cross in sight, further volatility is to come. And this is becoming quite concerning because what else can the Fed really do? They've already turned dovish, they've already said the word data dependency, etc. Um, so if we do see the death cross and volatility does come, well, this is coming in an era of dovish um, an era of a dovish Fed. So what more could they do in this situation? Things will become more and more, um, dire, I would say, if that continues. So I've been looking on a shorter time frame. If we put it down to a 60-minute— so we had was the G20 gap higher, equity markets gapping quite comfortably, about 1.5% higher, um, on the open, so 1.2% higher. And then it took a couple of days for us to go for this gap close, really going up, testing the 2800, coming in, taking out this R2 level. And then over the next couple of days, we saw the gap go and close, and that gap providing a decent amount of support here. Speaking this to— speaking about that trade with a number of the traders here, actually seeing somewhat of a recovery. But then we started to see this sell-off basically as soon as the US cash market opened. We just started hammering down, taking out these lows. Definitely some stops being run here, taking us through a range and down to the other side where 2,700 capped us to the downside. So this volatility is there. And if we look at— well, let's look at the Dow Jones, so your financial heavy index. Now the Dow Jones somewhat doing reasonably well here. Similar story, all-time highs and then coming under pressure. But looking at it on this technical sell indicator, the 50-day moving average sitting quite comfortably above the 200-day moving average. But I think we'll discuss in a moment, due to the yield curves, the Dow Jones is looking pretty fragile at the moment. But this, you know, 1.5% still to go for these moving averages to cross. But if we look at the NASDAQ, well, golden cross, death cross achieved. We've seen the 50-day dip below the 200-day. We have the cross. Quite an interesting space to see. This is a sell indicator, so these will be funds and asset managers having to close out their positions due to this technical sell indicator. This obviously driving down technology stocks, which is having— which is then forcing weight into the S&P 500. So a similar story being shown between these two. So we'll keep a close eye on the NASDAQ here. If we do see any more sustained pressure, almost certainly we're going to see the S&P have that death cross and volatility comes there. Another reason for the sell-off has been the recent inversion of the 3 and 5-year yield curve. And I know Piers was discussing this. It's no surprise to the market, um, but the 2 and the 10-year are showing a similar story. So I just quickly show you the more— arguably the more important yield curve that people monitor for this indicator towards a future recession. Well, this is the 10-year. So this is the yield on the 10-year minus the yield on the 2-year. So this is looking at the spread between those two. As you can see, every time we've dipped negative, gone into recession over the last 4 or 5 recessions. Um, this has been a one-way trajectory now for, um, you know, almost 10 years basically. Um, this yield curve getting flatter and flatter and flatter. But let's bring it all the way down to what we're seeing recently. Um, we've seen another dip lower. So actually the spread now not 0.15, and obviously 0 being flat and anything below that being negative. So anybody who's watching this yield curve story, you know, it's nothing new. We know where we've been going for a while. Um, but why is this bad for financials? Well, financials ultimately make money based on this yield curve. So they will borrow on the short end, or let's say you're a 2-year, or much less actually be in your months, uh, and lend on the longer end. So this is you depositing money in your current account, um, they're obviously using that money but they're borrowing it from you. So they're giving you a a yield or an interest rate, and then they will use that same money and they'll lend it out on the long term, the 25 years, the 35 years, uh, for your mortgages. Um, so your 10 years in this situation will be 35 years. But looking at that spread between the two, as the yield curve continues to flatten, well, their profitability, uh, lowers, and that should weigh on financial stocks. So keep an eye on the Dow Jones. I think, um, right now it's trade wars, um, driving the story. But as this yield curve, especially this 2 and 10-year, is going to grow, uh, into a bigger story, um, over the next couple of weeks and months, uh, in that case, the Dow Jones looking pretty, uh, exciting, uh, for some potential shorts. Technically, I was still in quite a bit of a range, not looking to be my favorite equity market as a whole. And just finally, just to put yesterday's sell-off into some context, having a look at this infographic here. It's just looking at the price change in the S&P 500, the Dow Jones, and the NASDAQ. As you can see, one of the largest moves we've seen, um, for the last few months. So mainly October 5th, October 22nd being the last time we saw sell-offs of this magnitude. Um, but look at the Dow Jones actually doing— this is in line with one of the largest sell-offs it's seen most recently. Um, so quite notable. I think volatility is here to stay. Um, I think there is one— there is one inkling of hope for this equity market, and that comes on Friday. And let's see how investors take that. Well, it depends on how today trades and tomorrow trades, but I think volumes— well, volumes are going to be lower today because we have, um, some of the market closures. So, uh, manage expectations that front. So we really have Thursday to play for. In terms of do we see a recovery, do we see sentiment shift for these major indexes. Because if they don't, well, then we're coming into negative sentiment into NFP, and maybe that won't be enough to lift sentiment. However, we do see a recovery in sentiment, then I do believe that Friday could very well be the beginning of the Santa rally. That's if we don't get the death cross in the S&P and we see somewhat of a recovery. And why do I say that? Well, a dovish Fed means we're well poised for a Goldilocks scenario where bad news further reiterates the fact that the Fed is not going to hike. And good news, well, that's good news for the US economy and the equity market recovers anyway. So if we see a lift in the next 2 days, and I think there's a lot to play for on Friday and then probably for the next— the rest of the month ahead. Um, so moving off the equity market, let's have a look at the pound. Now I know Piers and, and I've been covering this in quite a bit of detail. Sorry, it seems like something's come out. Nothing at the moment. Okay, so, um, having a look at your FX space, let's have a look at the pound here. And yes, they saw quite a bit of volatility. So your major FX pairs were being lifted post the G20 Summit. Well, actually since the Friday before then when Powell turned, uh, somewhat dovish. So, um, FX pairs, you know, coming to the top of their ranges. Um, also the easing of trade tensions, um, over the weekend also meant that we were seeing some outflows of your safe havens, the dollar being really used as a safe haven most recently, um, allowing sort of the pound in— well, the euro in particular, but the pound too, to be lifted, seeing some some decent upside, almost showing potential reversal from what we were seeing with deep downside days over the previous sort of weeks and months. But then yesterday, what we saw is Theresa May have 3 defeats in Parliament, and basically Theresa May was found in contempt of Parliament. Doesn't sound like a very nice place to be, and actually the first time in history that has happened. And as a result, this MP has voted and they are now forcing her to release the legal advice to them, which she was previously quite adamant on not releasing. So that'll be being released today between 11:00 and 11:30. This is the advice given to her by the Attorney General. And on top of that, the MPs also have been able to secure greater powers if Theresa May's deal fails in the House of Commons on the 11th of December, which almost seems certain now. I could say, well, I think that's market expectation, but after what she's just gone through in the past day, even the DUP has turned their back on her. So the DUP, obviously propping up Theresa May's majority government, they feel like they've been outcasted, their voice hasn't been listened to, and they're turning their back on her. So she can no longer rely on her coalition ultimately to prop up and support her and vote in her favor. I think 11th of December is— Theresa May, I'll be very, very, very surprised if she can pull it through. But if she doesn't, the MPs now have voted so that they have greater powers going forward in dealing with Brexit and the EU and any deal which is put forward after that. But, you know, 11th of December, in its essence, it seems like we're going towards either a no deal or a no Brexit. I don't think anybody wants a no deal, so there's no Brexit. Argument is growing. The only way that can really come about is probably another referendum, which I know everyone is— well, your Leave and your hard Brexiteers are probably not going to be happy with that, but it does seem like the most realistic scenario. In terms of a vote of no confidence, that could very well happen. So things aren't looking good for Theresa May, which is you know, sadistically does play into our hands where we'll probably see more volatility forthcoming in the pound. So all eyes on, on your sterling over the next couple of days. We're going to see more headlines, more source comments. Obviously keep Laura Koenigsberg's Twitter feed open. But I think the pound's seeing somewhat of a recovery right now after seeing quite a heavy downtick really coming from the top of the range. Down to S1. So from the highs and the lows, seeing a 1.5% swing in sterling. At the moment, we have found somewhat of a floor here, uh, being provided around the 1.267. Um, quick look on a longer time frame just to see where we are trading. So going back to a daily chart. Okay, yeah, so this is where we're finding that major support, which is the level Anthony's been talking about now for quite some time. And that's the low we printed in August. So this at the moment providing somewhat of a floor. So I wouldn't read too much at the moment into the fact that we are rallying. This is not, I would say, any renewed optimism. It's mainly due to the fact that we have quite a major floor preventing price action from going any lower. That being said, we do have UK data at 9:30, which we'll go over, uh, sort of at the end of the brief. I also want to just touch upon oil, uh, because in line with the sell-off we saw in the US equity market, um, we have seen some downside in oil. Now, we were expecting last night with the APIs of a draw of 900,000 in your headline crude numbers. Instead, we got a build of 5.36 million. So, um, a massive build compared to expectation. Actually, for API numbers, that's quite punchy. What reaction did the WTI market have to this? Let's flick across. Um, so looking at the last candle before close last night, so we saw oil markets— the oil market take another hit, almost down 1%. You know, we went from $63 down to 52.5, so nearly 50 cents, 60 cents lower, which is a punchy move for API. But let's put it into context. This move lower has been when the oil market was already on its lows and when volume was lowest. That's quite a punchy move following the API. So I think having a look at oil having to test that 50 level, we have recovered somewhat quite aggressively. Being up from our lows at one point, almost up 10%, currently up 6%. But, um, the APIs last night obviously showing quite a big bit of a build, so definitely oversupply in the US market. Now, we would normally see the DOE numbers coming out today, but given the fact that it's a bank holiday— well, is it considered a bank holiday? Well, market closure in the United States following to commemorate George H.W. Bush's, uh, recent death. Um, your DOE numbers will be released tomorrow, so that will be now on Thursday, 4 PM. So at the moment, I'd be using the U.S. equity market to give you a gauge as to where oil market is going to go as a proxy towards risk sentiment. Um, okay, let's have a look at the calendar and then we'll wrap it up for the day. So we did have some Australian data come out, so this is your Australian GDP numbers And actually quite a notable miss here, 0.3% versus 0.9% expected. Um, the growth rate quarter on quarter, 2.8% versus 3.1% expected. So actually not very good numbers. And if we look at the Aussie dollar, let me quickly bring up the chart. Some sizable downside seen over here. Market just on the close coming in, yeah, 0. 0.9%, so just under 1% lower, and actually have pushed lower. And since then, now down about 1% since the commencement of trade. Um, so again, Australian economy starting to take a hit. And really, that quarter-on-quarter, this trade war escalation really has been in the past quarter. Um, so we are seeing that could be an, an aspect which is an aspect which is affecting the Australian GDP numbers. Um, we had the Caixin PMIs come out last night, so the composite coming in at 51.9, so that's a beat on the 50.5 expected. Your services PMI coming in at 53.8 versus 50.8 expected, so that's quite a sizable beat there. Um, so this is market-sensitive data, so there is one glimmer of hope, and that's the Asian market at the moment is feeling quite optimistic. Albeit the services sector as opposed to the manufacturing sector. But, you know, there is some light at the moment in, in the face of this volatility. Moving on, let's come up to the data of what's coming. We have Draghi, who has been speaking. You haven't heard anything on the headlines just yet. Uh, he was speaking at 8:30. Um, coming into 9:30, um, first key set of data is the UK Services PMI. Um, now as important as this is, the trend is very much the downside, as you can see, uh, coming down to sort of the lowest print we saw this year, which was around the 51.6 mark. Um, let me have a look at the expectation very quickly. So consensus is for a reading of 52.5. That will still keep us relatively subdued here, 52.5, still one of the— well, lower than the average of the year for sure. Um, generally market-sensitive data, if we do punch down towards the 51.5, 51 level, I would expect to see a little bit of short-term volatility. Um, on the other hand, if we do see a punchy number here, I really want to see it get above 54. But again, I don't think this is going to be something which is going to be aggressively market impactful, um, when we do have the legal advice coming in at 11 and multiple Brexit headlines coming in, which will take precedent over this data set. But let's say if we have a poor number and then we have something negative come out with regards to Brexit, you could get that confluence of negative sentiment driving the market down. So, um, just flashing up your area, PMIs have just come out as well, but final readings. So non-impactful. Okay, having a look at the rest of the calendar, Euro area retail sales coming out, um, nothing too dramatic expected there. And then coming into the end of the day with the market closures, um, we don't have our DOE's— that's just getting home— so DOE is not coming out today. And finally, just for a wrap-up, just to give you guys a little bit of information about this market closure. It's not across the board, um, it's mainly affecting your bond and equity market. So your CME global trading hours for interest rate products will be closing on their regular time, uh, the— on Tuesday and not reopening until 11 PM today. So interest rate products at the moment, um, closed. Your CME open outcry FX products have normal trading hours on Wednesday. CME Global trading hours for US-based equity products— so they have an abbreviated session closing at 2:30 today, and then commencing trade once again at 11 PM tonight. So your US session, as we would have it in the UK, very much being closed. And the NYSE and ICE also open as usual today. So mainly your equity and your fixed income markets seeing lower volume today. But I think given the fact that we do have market closures, volumes will generally be lower. So I would be a little bit careful entering markets, be a little bit more defensive and wait and see. You know, we've had a risk-off tone yesterday. I wish we had full volume in the market today so we could really decide whether the risk-off tone is going to continue or not, but I don't think we're going to be granted that just yet. So manage expectations. If you had a good day yesterday, please don't treat it as coupons. Approach this day with a fresh set of eyes, mark out your ranges, and best of luck. If you have any questions, I'll be in the chat room. And thank you very much.
More from Anthony


Inside the Biggest Banking Stories You Need to Know This Week (Anthropic, Diageo, Private Credit)


Inside the Biggest M&A Deals You Need to Know This Week (UniCredit, GameStop, eBay, Eli Lilly)







AI Breakthrough or Hype? Anthropic’s Claude Mythos, Tim Cook Steps Down & LIV Golf Collapse