Morning Briefing - 10th September 2018
Anthony Cheung reviews US jobs data showing 201,000 added in August with wages at their fastest pace since 2009, a 98.4% probability of a Fed rate hike, and technical levels for the S&P 500, oil, and sterling amid trade-war uncertainty and Brexit negotiations.
Chapters
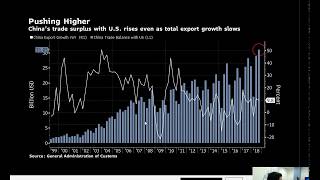
Okay, very good morning, Monday, 10th of September. So I hope everyone had a fantastic weekend, uh, just getting things underway then and look at the charts and, and really a preview for the week ahead because it's quite a busy one. If you've already done your homework over the weekend, plenty to, to look at. But starting off with the charts to get a general feel of the kind of mood and sentiment for this morning, and it's fairly Well, a couple of things that have been moving. Our bunds have had a bit of a drop here. If I just bring my chart into play, this is the German, obviously, bond market. The 10-year bund just having a bit of a dip on the downside. Looks to be somewhat accentuated by the fact we broke some, some technical levels from that of last Friday and that previous low that we had. This is going back to about 5 days ago, so an instant run down to around that S1 level. Equity markets, though, not so much, as I say, based on the— upon the back of any significant news. But European equities broadly flat, slight positive for US stock futures. We'll have a bit of a recap of payrolls in a second. And in the currency markets, you've got a bit of a dollar pullback since Well, I've really started talking in the Trading Live chat room the last 15 minutes or so, but pretty flat in the DXY. But as you can see here, both the major currency pairs just seeing some moderate upsides. Um, you can see cable here just touched on fresh session highs, coming back to flat now. So just having a look at its top end of the Asia-Pacific range at the moment. Gold a little lower, only marginally. Just sub the 1200 handle, so trading about a dollar beneath there, down, uh, $1.7 on session. And then the US 10-year, I mean, if I just look at this chart here, even having been off the desk on Friday afternoon, I can see quite clearly the, the kind of market interpretation of what it thought from that, that pop in the wage data following payroll. So on that note, let's just have a quick look at those numbers and refresh our memories of what happened. And here we had the payroll number. It rose 201,000 jobs, the change in non-farm payrolls in August, and the unemployment rate holding steady at 3.9% for a straight month. I don't think this is really much of an equation. I think if I remember rightly though, ADP was a little soft, so maybe a bit of an upside surprise on the headline given the fact that it came in at this figure. And you can see there being very constant. Uh, you've got this one anomaly here, but really, if we look at really March and September of 2017, this is very much weather impacted. So if you're X-ing those out, then hence the reason why the Fed are very comfortable with the rate of employment. The other thing though that was probably more of the key catalyst was of course this: US wage growth picks up to the highest pace since 2009. So quite a nice graphic here, just to look at the bottom axis, to look back all the way to the pre-financial crisis era that we were at, when wages were kind of edging up towards what was a +3.5% year-over-year change. And then obviously the dramatic fall as the unemployment rate shot higher, and then the recovery that we've been going through. Now, the recovery has been incredibly slow, and hence the kind of gradual, cautious approach to the rate normalization process in the US. But why last Friday's jobs data was interesting was because if you look at kind of the peak of 2016, 2017, and 2018, we've now moved out of that range to the highest levels we've been in pretty much a decade at this point. So does this bring about some renewed concerns? Again, if you remember February when the equity market had a bit of a shakeout because of this idea of policy tightening. Now, at the time, there was, you know, the economic conditions were quite different. There was no emerging market kind of concerns at that point. The kind of trade talks weren't at the point of escalation that they are at the moment. So you haven't had the same quite results, certainly in the equity market, with stocks holding relatively solid. But US yields certainly have moved, and the US 10-year at the moment, probably worth just keeping an eye on this morning. The bottom end, this bottom right-hand corner chart, the lower bound of that range post the payroll release that we had, we're just testing it at the moment. What does this mean then for rate hike expectations? Well, it doesn't get any more priced in than the 26th of September, which is when the Fed are expected to to increase interest rates by 25 basis points. The probability of that, as measured by federal funds futures, is now 98.4%. And so September hike is definitely on the cards and most probable, and then December to follow, meaning that the Fed have executed their 4 as kind of outlined at the beginning of the year. Question mark still though over the trajectory of 2019, just given some of these other external headwinds at the moment. Speaking of that, the biggest kind of potential disruptor to the Fed obviously is this of the ongoing US-China trade spat. And this was on Friday. Obviously, you guys were probably here and caught the bulk of these comments. President Trump doubling down on his threats to impose higher tariffs saying he's ready to tax all imports at short notice. And this did see quite a reaction at the time of release. Trade data as well for August released Saturday— this is for China— echoed both the cause and effect of the standoff with the US, with the surplus with the US rose to a record while overall export growth has slowed. I was just looking at this here. So the white line being the export growth year over year, you can see, I mean, quite erratic actually over recent years, uh, has slowed slightly. And the Chinese trade balance with the US has continued to kind of balloon at this point to the level you can see here on the left-hand side at $31.05 billion. Definitely this is something to look out for this week still. As we're going to look out on the scheduled economic data for the week, there's plenty to go at from the US, from CPI to retail sales, with also some, some individual company events worth monitoring, i.e., Apple on Wednesday night. But this commentary pertaining to the trade war still is arguably the most dominating factor if it was, you know, Donald Trump is to to really ramp it up, which he has been threatening to do so just at the end of last week. Looking at the S&P chart, my head of technicals, Mr. North, has sent me through already a couple of, uh, interesting charts to have a look at. So I'll include these on the weekly strategy report later on today. And as you can see here, nice chart to put into context some of the recent price movement because this encapsulates pretty much the year-to-date And what we're looking at here obviously is where we're sat this morning at around 2879, um, is quite an interesting price point. This was the previous all-time high of course that we had right at the beginning of the year before that kind of wage data inflation, um, fear that emerged in that big sell-off that we had. So we kind of sat right around those levels at the moment, having pulled back from the recent you know, and only around a week or so ago, all-time high that we printed. So quite a nice kind of channel here that you can see on the upper bound if we were to get back up towards the 2900 and above, and then on the lower bound, this kind of support points being identified from mid-June, also from early August should we look to pull back down lower. You can see if I was to draw a horizontal line here from what were the highs right at the beginning of August, straight across. That probably match up quite nicely to the tick to that previous low point that we can see printed here, which would have been what, Friday session. So whether we can come down to there, be interested to see how the market will respond at this price point. Still favor this, basically this trend continuing. So if we did get down here, I'd be interested to see whether this can hold. My belief would be still that this would be the case. With the only real, uh, I would say, catalyst that could create then a snap lower and a meaningful push down, which would probably open up then this 2846.25 as he's got marked, that being the previous highs at this point in mid-July and also support back in early August. Be looking at that as a potential next area of support, followed scaling down then to these areas here from the 13th of June and mid-July, early August, just sub the 2800 level. But still, for the moment, be looking for the market to respond here would be my baseline for the week ahead. Looking elsewhere, other things that have been going on— you probably read over the weekend a couple of Brexit headlines. Firstly, one from the EU. This was in the FT last night, talking about the EU is preparing to give its Brexit negotiator new instructions to help close a deal with Britain. In a conciliatory move that would bolster Theresa May as she's kind of under attack in her leadership at home at the moment. The market hasn't really responded to this article despite its obvious optimism from the, from the tone of the report. An informal meeting in Salzburg this month between the EU's 27 remaining leaders is emerging as one of the most significant Brexit discussions since the bloc first set out its strategy for talks. And apparently, according to the sources, Barnier has kind of been given the instruction, you know, to kind of push things along, which would be a positive. But, you know, we've been here before. And if you remember the price activity of the pound last week, it was a bit of a roller coaster because initially Barnier was kind of positive, then he reversed that, then the source comments came out on Bloomberg talking about UK and Germany getting close to towards agreeing something, and then that got rejected by a Reuters report. So I think the market's a little bit reticent to commit to these headlines, which are only likely to intensify going forward, particularly with the party conferences respectively happening, of course, Labour at the end of the month and then the Tories at the beginning of October. This, of course, does come as well with those party conferences coming up As to be expected, Boris Johnson's been kind of stepping up again, and at the weekend the former UK Foreign Secretary basically sticking to his guns, highly critical of May's Brexit strategy, comparing it to wrapping a, quote, suicide vest around British Constitution. And obviously he's been quite condemned by his choice of words given the kind of context. But certainly more from him, I'm sure, as we get closer to that. There's already reports that he's going to be staging a protest at around the time called a Chuck the Checkers rally, where apparently there's about 1,000 party activists are going to be taking place. So Theresa May's definitely got her hands full at that conference in Birmingham in early October, not unless some movement or positive wording, let's say, is developed between the UK and Europe. If she acquires that, then obviously that strengthens her hand. And so gonna be interested to watch as that unfolds. Now, looking at the pound, obviously both major pairs seeing a bit of upside as I'm speaking. This this morning as the dollar just pulls back a touch. But a few other things to be aware of from a technical standpoint for cable. So this is that longer-term trend line that we've been looking at for a while, dating back to really April. And you can see here how nicely that's been holding up through the various ebb and flow of price activity. This area here was when we had the, the Trade Secretary Liam Fox comment about the 60/40 for a no deal, and that prompted the market to reprice then in the prospects of that gathering pace. And we broke this kind of trend line to the downside which defined the near-term price low that we've had around the 127 handle. We have recovered slightly, but again, this, this trend line still holding for now. You can see on 2, 3 clear occasions, and so going forward, we're in a bit of a consolidation pattern As we go through today's session, we've got GDP actually coming out, we've got a Bank of England rate decision to navigate. But my quick thoughts on that are, how much have you read about the Bank of England's bank or interest rate decision in this morning's press? Absolutely nothing. That's because it's a non-event, and so not expecting too many surprises here. And if anything, I'd be interested to see this is quite key technical levels going forward for the rest of this week, contingent on not so much probably the Bank of England. We do have some economic data, as I said, the GDP. You've got wage data as well from the UK, which is obviously quite pivotal for the— an insight into inflationary conditions. But I think just any developments on Brexit, if we're going to really break out some of this technical pattern, then it could be dependent on on movement on that front. Elsewhere, this is some of the headlines for crude traders to be aware of. I have just seen actually a couple of comments here about Libya just while I've been speaking. Blasts have been heard at Libyan National Oil Corporation headquarters in Tripoli according to operational witnesses, but this also comes after We've had some disruptions in Iraq, or as far as the country is concerned, they've been managed to pump back crude oil record levels unaffected by protests. Let's give you a bit of a reference point by the numbers. Iraq is producing crude at a level of about 4.36 million barrels a day as agreed with limits set by OPEC and has capacity to pump around 4.75 million. So not too far from that at the moment. Security forces down in Basra were taking measures this weekend to protect oil fields and foreign employees. Iraq boosted protection in the south. So let me just show you what this looks like for any of those not familiar with how the land lies in Iraq. This is always quite useful, I think, if you are seriously going to be trading oil, then you know, when we're talking about these biggest producing countries within OPEC. So you've got Saudi Arabia, obviously, to the, to the west of the country, or the south in this case. You've gone and got to the east Iran, and then to the, the southeast Kuwait, all bordering on the Persian Gulf. So these are your top 4 producing OPEC nations by size, Iraq being the second, of course. And so you can see here, it's Basra where the rural oil fields are situated predominantly. Supergiant oil fields are denoted by the darker blue kind of pools here that you can see, with the main network of oil pipelines then with the tanker terminals so they can feed out into the Persian Gulf. So it's this particular area that's been affected in the south after protesters demanding jobs and basic services torched government buildings. And the Iranian consulate in the southern city of Basra. A number of them briefly forced their way into a water intake facility that supplies an oil field operated by Lukoil on Saturday. And so definitely worth just keeping an ear on the developments here because just given the kind of size of production and the dependency on the southern part of the country for the predominant amount of the supply. Any disruptions here could have a meaningful impact for the price of oil. What does oil look like this morning? We've got it down here in the bottom center chart, on the front foot. So we've had a bit of a pullback, as I said, in the dollar more recently, but we've just managed to stretch above the Asia-Pacific highs and we're just testing the R1 at the moment. So we're up about 58 cents this morning. So it's something to just be aware of. On the technicals, longer term, this is some of the patterns that Sam's keeping an eye on as we go forward. And so I guess upside's got just short of the 72 handle, looking at the kind of SEP high, and then this trend line lower that's contained a lot of the price action through the best part of the month of July. So if we come back down, the market has responded roughly to that point. So as we come back down here again, 66 handle could be quite interesting, but probably the strongest point of clear, um, horizontal support in this line. You can see on these previous occasions right back at the beginning of the year through mid-July and August, this is quite a key area right here, 64.34, uh, kind of 64.3450. Would be very critical. And you've also got this 200 daily moving average scaling in, all crossing at that same particular point. So at the moment, I would say still more a preference to be sitting on a long positioning bias. And obviously, if we got down here, would be particularly interesting to play that out in terms of the price going back up and that being the lower bound if we did move down. However, obviously with the overall big macro story still driven on the trade side, that typically has been a negative on escalation given the, the knock-on impact to subsequent demand if it was to materially worsen as a situation. But otherwise, all the other factors still remain on the more bullish side. Also as well, still tracking the NHC couple of weather patterns are forming in the Atlantic at the moment that are probably also worth just being aware of. One of the other things we've got this week, of course, is, uh, not only the Bank of England, uh, and also to be aware of if you're looking at emerging markets, which is still a big tail risk, you've got the Turkish central bank decision this week as well. But from the developed nations, you've got the ECB. Now, the ECB as well could be a largely non-event, this being for the fact that, as the research report here would suggest, the ECB are a little bit on autopilot because they've already outlined their reduction of monthly QE from €30 to €15 billion going forward. So just really confirmation of that. There are a couple things that potentially could disrupt the process of, of kind of gradual tapering of QE. And policy tightening to that respect. This being trade war, the Italian fiscal, i.e., political situation harming eurozone sentiment. But all of that at the moment not really at a point, I feel, to detract from what their current communication line is. So not going to go over this anymore. This research report is in your inbox, um, so do take a read if you get time. Looking at the euro currency technically As I said, the market's already responded really to this technical point, which at the time when Sam marked these charts up a good hour ago responded quite nicely to that 115.38, 39 type level, which was pretty much defines the, the low point of the session on the turn. So nice call on that, Sam, if you were getting long at that point. Any move back higher Uh, this is again broader for the week ahead. Again, interestingly, if we were to get a kind of a hawkish setup from the ECB— not that I'm expecting that— but there are some levels here, uh, that being reversal back to some of the levels at the end of last week, and then this kind of trend line rising higher up in toward the 118 handle depending on the time frame of when we get there. But as per usual not just obviously a euro consideration. There's a lot of US data coming out as well as the monitoring of the trade war situation. So it could be the dynamics of the dollar that really drive the, the currency pair here more than anything else. On that front, let's just have a quick review of what is coming up. As you can see here, we've got UK GDP that is due for release in about 35 minutes. I'll go over that in more detail shortly. Alongside that, you're also getting UK trade balance, IP, and construction outputs. A few things to be aware of, um, just in case as well. We talk a lot about US and China trade talks, but today the US Trade Representative is visiting Brussels for EU trade talks. And as you'll remember, it was last week where basically Trump said that Europe is just as bad as China, they're just smaller. So certainly if that aggressive line is maintained, this could also act as a potential destabilizer, if you, if you like, of short-term market sentiment. So do be aware of those talks. One would imagine then probably around the afternoon if we're going to see something you'd have to look out for. Going further forward, and I'll try and club these together as per country to give you a bit more of a better idea, but China there's quite a few key things actually for the week ahead. Tonight, i.e., going into tomorrow morning, you get foreign direct investment, new loans data. Then on Friday morning, early hours, you've got fixed asset investment, industrial production, retail sales, and unemployment rate. So quite a few things here, and, and people are quite closely monitoring the health of the economic situation in China as the screws kind of start to turn and meaningfully impact the the economy with the ongoing trade spat. And so what the question is, is how bad is the situation and how worse can it get before further kind of, whether it's central bank or government intervention, needs to take place. I was looking at some statistics this morning. Although the Hang Seng has been performing a little bit better than the mainland stock index, I think the Hang Seng is now down 19%. From the beginning of the year. So these are considerable declines that we've been seeing. Otherwise, looking at the UK, you've got the UK average earnings data you can see here coming out on Tuesday. This follows today's GDP release, and you've got the Bank of England coming on Thursday. From a US point of view, for economic data, uh, your regular routine with the inventory numbers from the API and DOE on Tuesday. Wednesday respectively. You've then got the CPI reading on Thursday with US retail sales coming on Friday. And then for any single stock watchers, I'm sure any, uh, those interested in the tech space have been reading plenty of news coverage over the weekend about Apple. Apple's special event, of course, is taking place on Wednesday. This is when they're going to unveil their kind of iPhone X Plus. A quick overview here: they're basically going to release new models of the existing phone, one with an improved OLED screen that's more high-resolution than the existing iPhone X, and then they're also going to release the same phone but with lower component cost parts so they can then move away from this $1,000 price point which was a bit of a barrier to entry on the initial iPhone X. So they're basically taking existing product, having a premium version of it and a cheap version of it, expanding on their existing products as well as a new Series 4 iWatch and so on and so forth. So a couple of things to look out for, and that's always quite a big fanfare around that event, and to be looked out for aftermarket of course. Okay, That's it, I'm gonna leave it at that. 9 o'clock coming up, so I'll get the morning strategy out to you in the next hour or so. Otherwise, I'll see you in the chat room and have a, have a good day and a week ahead. Thank you very much.
More from Anthony


Inside the Biggest Banking Stories You Need to Know This Week (Anthropic, Diageo, Private Credit)


Inside the Biggest M&A Deals You Need to Know This Week (UniCredit, GameStop, eBay, Eli Lilly)







AI Breakthrough or Hype? Anthropic’s Claude Mythos, Tim Cook Steps Down & LIV Golf Collapse