Morning Briefing - 26th September 2018
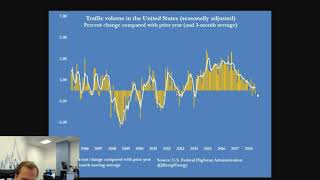
In this morning market briefing the presenter gives a rapid overview of global equity performance, crude‑oil market dynamics, US traffic‑volume trends, and the macro‑economic backdrop ahead of the Federal Reserve’s September rate decision. Asian equities posted a solid session, with Chinese stocks up over 2% after a two‑day holiday, while European markets opened positively but quickly lost momentum. Crude oil traded around the $72‑$73 level, holding above a recent double‑top despite a surprise API‑reported build of 2.9 million barrels and a Cushing build of 260 k barrels; the upcoming DOE inventory report is highlighted as a key catalyst. A longer‑term US traffic‑volume chart shows a recent negative trend, historically a leading indicator of oil‑price spikes. US macro data show strong short‑term GDP growth (2.9% annualised) and a tight labour market, supporting the Fed’s expected 25‑bp hike and a hawkish dot‑plot outlook, with attention on 2019 rate expectations. The presenter notes a valuation divergence: US equities trade at higher P/E multiples than European stocks, which are at a five‑year low relative to the US, suggesting potential rotation. The briefing ends with a concise economic calendar, emphasizing the DOE oil inventory release, the Fed’s FOMC decision and press conference, and a brief mention of upcoming housing data and ECB commentary.
Chapters
Okay guys, let's get the briefing started here. Um, short briefing this morning. I think that's because not too much by way of major development. Let's just have a look at the charts. I mean, what's been interesting is that whilst Asia had a decent session, um, I mean equity-wise, and there are some numbers that look amazing like Chinese stocks up 2% plus, but you've got to understand they've been closed for 2 days. So just bear that in mind. But despite that, generally positive Asian session and it started well in Europe as the DAX at 7 AM opens right up at the— or to test the high point that we had back yesterday. Kind of what time was that yesterday? So just coming into midday, up at 12, just above the 12,400 handle, we hit our one. But actually since then it's actually been quite a steep pullback. So we're back into that range that we had going into the close yesterday, hanging around the pivot. We've caught a bit of support here with this double bottom from last night. But yeah, Europe trying to kind of follow the mild positive tone from Asia at the open, but actually it didn't last long. So stocks back under a little bit of pressure here. So what's going on headline-wise? I mean, not too much. Trump was in the UN yesterday. Here he is. And really, the only takeaway from his speech was that he informed us that Saudi Arabia and OPEC are ripping off the world. And so this was his attempt yet again to try and talk the price of crude oil down. Of course, that has failed. Here's the price of crude oil this morning. We're just ticking up through the pivot level here. But, you know, nicely in this range that we've kind of settled in as we broke up through the $72 handle. It's been pretty nice. We've got a double top here for the week, up around $72.74. So that's a price point on the upside. If we do climb through the morning, then that's certainly a target. $72.82 is that high point that we had a couple of months back. But crude still up here, nice and solid and positive. We overnight, we tested yesterday's low, seems to have produced enough support for now. And that's despite last night getting the API data that actually showed a surprising build in crude oil. Um, let me— sorry, let me just go back because if you look at the numbers here, and if you can see this, but crude build, uh, 2.9 million barrels, uh, build on crude. Cushing was also a build of 260,000. Gasoline, a build almost a million. And so it's only distillates that got a drawdown here, but a surprise crude build and surprise build in Cushing stocks. So that was the API readings last night. Of course, we're going to get the Department of Energy numbers at 3:30 this afternoon. But last night we did get a bit of downside. That's what took us down to test yesterday's low overnight. But as you can see, it doesn't matter. We're actually trading back to where we were before the API numbers were announced. So that's a pretty good sign, I think, for me when you're trying to judge. And let's look at this on a slightly longer term. You know, we have got a nice solid punch higher here over the last few weeks. And when you're trying to gauge momentum of a trend. I think it's always good to, you know, if we get a negative event that does not trigger, you know, meaningful sustained sell-off, then that's a pretty good sign that the buyers are still in control of this and the upward trend should be healthy and ongoing. So a little bit of a chance last night for the sellers or even the buyers to book profit therefore selling, and for that to lead to perhaps a pullback. But it didn't happen. So I think going into today's session, I'd still have a positive bias for crude. Obviously, we'll see what the Department of Energy numbers bring. I've got an interesting chart here, just thinking a bit more longer term. This is a chart going back over the last— well, whatever it is, back to 2005— traffic volume in the United States. Seasonally adjusted. And actually, what's happened in 2018 is this has turned negative. So that's the volume of traffic growth has dropped, and actually it's now shrinking. So this is the first time since 2013 that volumes of traffic have actually declined. This is typically quite well correlated to the— or inversely correlated, I should say— to the price of crude oil. Of course, what's happened over the last 12 months or so is that crude has climbed quite consistently, which of course has led to petrol at the petrol pump prices rising and rising and rising. And this is beginning to start to bite. Okay. So you might say that as vehicle volumes fatten, that's not demand dropping unless this thing properly sustains a negative move, which it hasn't. We're kind of chopping up and around through the zero point at this, this moment. So actually kind of demand from the volume of traffic point of view is kind of flattened here. The thing about this is the last few times that, that demand has gone— or let's say, I should say traffic volume has dipped negative— the last few times has actually been a lead indicator to what has then gone on to be you know, a big spike in crude prices and crude prices hitting kind of multi-year highs. So you saw that back at the end of 2013. Before then, the powerful move higher into 2014. We saw this back in 2011. We saw it back in 2008. And in fact, 2007, we turned negative and then it was into 2008 that oil prices moved above $100 and almost hit $150. So Despite— that's a bit counterintuitive, that, because if volumes of traffic are dropping and are perhaps neutralizing or maybe even turning negative, when you're thinking from a demand point of view, that could be a negative for price. But it does seem to have a lagging effect. So whilst this is interesting, it shouldn't be interpreted as, right, this is the top for oil prices, demand's turned weak, and we should therefore see prices drop. That's— that hasn't been the case in the past. But I thought quite an interesting chart just to reflect the fact that petrol pump prices are actually now right up there and beginning to bite. So thinking a bit more economically, when we're hitting 2019, then, you know, it may be that the US growth momentum maybe starts to get damaged and undermined by this high petrol pump situation. So Now that I've mentioned that, I mean, let's talk about the Fed because the Fed are going to hike tonight, another 25 basis point hike. So why? Let's have a look. Why are they going to hike? Well, this is one key reason: the economy is uber strong. Um, well, I should say relative to recent years. And here we are, this is the GDP annualized growth rate punching up to 2.9%, and as you can see, easily the best growth rate on this view, that's going back to 2015. If you go to a 5-year view, well then actually, yeah, all right, so it's not as good as we saw in the start of 2015. And then actually go to a 10-year view, and okay, you've got the financial crisis in this frame now, and so of course relatively this looks very high. But when you look at a maximum, so this is GDP growth rate in the United States going back to the sort of '40s or '50s. And you see on the right-hand side where we are at the moment, and it's actually, well, at best bang in the middle of the range. And indeed, that is correct. Really, on average, take the last few decades and the average growth rate in the US has been just a touch above 3%. So long-term, 2.9% here is nothing to write home about, but short-term It's the best growth we've seen for years. Okay. And so this is why, coupled with obviously the tight labor market conditions with the likes of the unemployment rate, you know, down at multi-decade lows, then you start looking at the wage growth data at a 9-year high and you start looking at inflation conditions up around target. Then, you know, this is why the Fed are going to hike. Okay. So this should not This isn't the big event tonight. It's not, are the Fed going to hike rates today or not? They definitely are. This is looking at a rate kind of gauge. This is the gauge. You're definitely on hawkish, obviously on the hawkish end of the spectrum. Obviously they've been hiking. This will be their third hike this year. We've got the 5 hawks over here on the right. George, Rosengren, Mester, Williams, Barkin. You've only got 3 doves to kind of try and balance that off. Evans, Bullard, Kashkari. The others are neutral to possibly slightly hawkish, depending on which one you're looking at. So the Fed will hike. It's quite a good graphic from ING Index here that just giving some of the quotes from some of these main guys, um, from recent weeks. Brainard, you know, these developments raise the prospect that at some point the committee setting of the federal funds rate will exceed current estimates of the longer run Fed funds rate. I don't see an inverted yield curve, says John Williams, which is something that some people are worried about. If the Fed continue to hike and hike and hike and that short end of the curve continues to tip higher and higher and higher and the long end, or the 10-year, let's say, is still anchored at 3%, well then you're risking a yield curve inversion. And so on, you can read through these and we'll cover the Fed in much more detail later. But certainly, you know, it's about— it's not about are they hiking today. They are. So it's more about the dots. Of course, we're going to get a meeting— sorry, a press conference. We're going to get an update on their inflation and growth forecast. We're going to get an update on the Fed's dot plot, which is what I'm showing you here. So just as a quick reminder, each Fed member gets one dot for each year, and they're asked to plot their dot where they think interest rates should be at the end of that year. So everyone plots a dot. Where do you think interest rates will be at the end of 2018? And here we've got currently— this is the Fed funds rate— between 2.25% and 2.5%, which means if that stays the same at today's meeting, that means we've still got one more hike to expect in December to round off a 4-hike 12-month period. All right, so we're not expecting any change here on 2018. We're expecting them to continue to guide us 4 hikes this year. That's because growth is uber strong. However, as we go into 2019, you know, are we to expect growth to start to hit some headwinds? You know, the Trump tax cut stimulus will have faded, and the fiscal spending boost will have faded. We've got higher oil prices, as I've just been talking about, which is squeezing some consumer spending ability. Yes, consumer confidence is at a multi-decade high at the moment, but will that kind of soften as we go into 2019? What about the trade war risks? Because, you know, we talk about tariffs on $250 billion worth of Chinese goods coming into America now. But almost all of those tariffs have only just been implemented, so it might take weeks stroke months for these kind of price changes to filter down through the supply chain and end up with actually maybe the consumer being the one to, um, fork out and pay for it. So consumer prices rising. So this might come in, you know, as we turn the year and move into 2024. 2019. So what we're, what we're perhaps most interested in at today's meeting is the 2019 dots, because they're quite clumped. And do we get— it's only going to take one person to revise down their 2019, end of 2019, um, dot by one quarter point. It only takes one dot to go lower for then the median to drop. And if it does drop below 3%, then here we're looking at actually fine, 4 hikes in 2018, but then we're looking at 2 hikes in 2019. Okay, so, um, 2 hikes and most likely Q1 and Q3. That's the current thinking. All right, so it's really all eyes on the 2019 dots, I would say, um, for guidance, uh, towards next year's rate hiking expectations. And just how nervous are the Fed about momentum of growth dropping. They shouldn't be nervous. I mean, the economy is uber strong, so it's not a question of being nervous. It's— cautious is a better word. So we'll see what Powell has to say for himself in the briefing later on. Um, okay, so, um, the other thing I just wanted to quickly touch on, um, because I had a bit of a graphic that I was going to show you which I've now lost. Here we go. I wanted to talk about this on— and kind of it ties in with what I've just been saying. So the US is uber strong at the moment. And what we've seen this year is actually a soft patch for Europe. We've got this major divergence between European and US equities, and I should say US and Asian equities as well. Basically, US equities are through the roof. Asia are very weak, bear market territory in certain cases. with Europe kind of stuck in the middle. Europe around about flat for the year. Here's a look at the P/E ratio comparison between European and US companies. And right now you've got the situation where on average European companies' P/E ratios are just 80% of those of their US counterparts. And as you can see on this chart, this is the lowest we've seen for more than 5 years. Basically, this means Europe is cheap. And the US is expensive if you're only looking at a P/E ratio comparison. And you're starting to see some noises from fund managers in the US saying, well, you know, we're going to start to look to rotate. We're really much more interested in looking at value coming from Europe and Asia now. We may well be rotating some of our funds out of the US, which has done so well for us and starting, you know, where, which is looking pretty expensive. Are certainly on a relative basis and starting to perhaps rotate a bit more into Europe. So you're getting more and more articles in the FT, for example, more and more comments on TV about this idea that the divergence between the US and Europe can't last. And actually what's going to happen as we tip into 2019 is that you're going to see the US correct back. Is Europe going to rally as well at the same time? Is that Divergence going to turn into a double convergence where US drops and Europe goes up? We'll have to wait and see. But we do think that the US is looking toppy. However, having said all of that, we are, you know, we are close to 3,000 on that S&P, and it's almost like it would be a shame if we didn't get there. I mean, I know that's a stupid thing to say, but 3,000 is such a landmark price point for for this index, and certainly the upward trend from a technical point of view is healthy. So whilst the back end of this year into 2019 may well see this phenomenal rally kind of come to an end, it may well not be over just yet. So food for thought. Right, let's finish on the calendar. Data-wise then, obviously all eyes on the Fed later, and before that you haven't really got much. So again, another really quiet day morning for European— sorry, economic data. Basically nothing of any note. And then into the US session, and really the housing data at 3:00, new home sales, but again not massively important. This housing data tends to come in late. This is for the month of August. We're almost at the end of September now, so this isn't that market influencing. So really you've got the oil data at 3:30, which is obviously an important one for you oil traders out there, with the Department of Energy forecasts showing a drop of 1.6 million barrels. But of course, we got a build from the API last night, so we'll talk more about that nearer the time. And then on the speakers front, Draghi's at it again, but he did speak, of course, end of last week, so he's not really going to change his tune and say anything different. So really, it's, it's oil data and then it's the Fed. So the Fed 7 PM is the FOMC rate decision, uh, and then it's 7:30 will be the press conference, uh, with Powell stepping up live. So that's the order of events. That's it from the desk for now. Uh, good luck, enjoy the session. Thanks a lot.
More from Anthony


Inside the Biggest Banking Stories You Need to Know This Week (Anthropic, Diageo, Private Credit)


Inside the Biggest M&A Deals You Need to Know This Week (UniCredit, GameStop, eBay, Eli Lilly)







AI Breakthrough or Hype? Anthropic’s Claude Mythos, Tim Cook Steps Down & LIV Golf Collapse