Morning Briefing - 7th September 2018
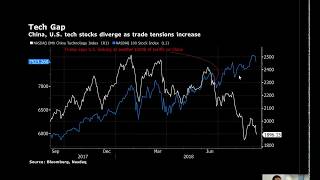
In this morning market briefing, the presenter focuses on the escalating US‑China trade dispute, highlighting the imminent threat of a new $200 billion tariff tranche and the timing of potential Trump tweets. He contrasts the continued rally of the US NASDAQ 100 with a sharp decline in Chinese tech indices, noting a 12 % drop in the MSCI Emerging Markets exposure to Chinese firms. US small‑caps (Russell 2000) are shown outperforming global equities, supported by strong domestic growth indicators (GDP >4 %, ISM at 2004 highs) and an upcoming Fed rate hike. The Chinese offshore yuan has depreciated about 11 % since March, raising concerns about capital flight. Trade tensions have also hit US agricultural exports, with soybeans down ~22 % after a 25 % tariff on US products. Emerging markets have fallen ~20 % since early 2018, and a Goldman Sachs risk calendar flags upcoming events in Brazil, Argentina, and South Africa. UBS research suggests a 5 % S&P 500 drop if a 25 % tariff on the $200 bn tranche is imposed, a scenario they claim is not yet priced in. Historical analysis of US midterm election cycles shows a typical S&P rally in October, potentially offsetting trade‑war downside. The presenter advises caution on the day’s non‑farm payrolls, deeming it a low‑signal event for trading, and recommends a conservative stance given possible Trump‑tweet volatility. He briefly notes oil price movements and the lack of a new Canada‑US trade deal. The overall tone is analytical and cautionary, urging traders to monitor trade‑war developments and macro data while avoiding over‑exposure to headline risk.
Chapters
Okay, very good morning. It is Friday the 7th of September. I hope everyone is well. And just going to go over— really, it's the ongoing US-China trade spat that's going to dominate this briefing. A couple of very interesting graphics I think I can talk you through to summarize the present situation and the potential threat to market activity for the day ahead. You're going to have a very brief look at non-farm payrolls, but we're going to go obviously obviously in that, into that data set in more detail as we get into the afternoon. But just kicking things off, a broad look at the cross-asset class kind of mix on the charts here. And pretty quiet. This is very typical of a pre-nonfarm release. And it's almost potentially this morning going to be further exacerbated by the fact that you've got this kind of tail risk that President Trump is said to be ready to push ahead with tariffs on $200 billion of Chinese imports after basically the deadline ended yesterday. So there's kind of that threat. We know from Trump timing though that typically it starts to come if he's going to tweet and comment from really about 11:30, 11:45 onwards. So maybe not just for this morning, but no one's really going to be want to initiating any type of positioning too much with that tail risk of a headline or tweet coming out. And then also with nonfarm payrolls, people tend to just sit on the sidelines and wait for that major market event to unfold first. Not, as I'll discuss shortly, that I think it's greatly important anymore or particularly tradable, to be honest. Certainly not if you're looking for a more consistent approach. Um, but yeah, Non-Farm's coming out and people like to, to just wait and see before showing their kind of hand and entering the market, if at all. Let's just have a look then, a few things with the kind of threat then of a further extension, or escalation I should say, on behalf of Trump with an additional $200 billion on tariffs on Chinese imports. A couple of graphics I want to run through with you. This one first, this is looking at the, the impact that the ongoing discussions have had so far on the technology names in particular. So one of the main targets of the Trump administration has been to target specifically the Chinese tech sector. The US has proposed tariffs, if you remember, this was back at the end of Q1, and it was in response to unfair trade practices is how they deemed it. This tied to tech transfer, intellectual property, and innovation, and so on. So what we're looking at on this chart here is how really the two lines were fairly correlated, albeit slight divergence on the values, but very much so up through the beginning of the year. And then when Trump said he was looking at an additional $200 billion on tariffs back just really several weeks ago, that's when the divergence has occurred. And what we've had is the, of course, NASDAQ 100 pushing up to these record all-time levels, these kind of milestones hit for the likes of Apple and Amazon. So the US economy has plowed on, and, and that being the case of the NASDAQ. However, the NASDAQ OMX China tech index has been falling rapidly. To give you an idea, this includes companies like Baidu, Alibaba, Tencent, all the big tech heavyweights in mainland China, and they're down roughly, looking at some of the indices, about 12% as measured by the MSCI Emerging Market Index. So we are seeing this, and this has been, as we're going to see with other charts, real meaningful impact on the Chinese economy in particular. Another quite interesting thing that's been apparent with these ongoing trade talks has been this. This is looking at a, a bit of a decoupling actually, is what Bloomberg are referring to, and it's looking at US small caps. And so for those not familiar, obviously when you're trading the main kind of benchmark, let's say premier index like the FTSE 100, there's obviously lots of subcategories, but also weighted-sized companies which scale down then into FTSE 250, 350, mid-caps, and so on and so forth. And this is pretty much reflective across all countries. So in America, the one that people look at for a bit more of a let's say a sentiment read or a flavor of the domestic situation is the Russell 2000. So what we're looking at here is on the white line the Russell 2000 against what is the, the kind of broader market indices. So on a broader scale, US small caps have outperformed global stocks and seen as being relatively immune from trade disputes due to their elevated domestic exposure. So if you think about it, at the moment we've seen US economic growth, GDP in excess of 4%. We've had ISM indicators printing at their highest since 2004. So economic conditions are continuing to, to move forward in a positive fashion in the US, and hence subsequently we're looking for the 8th in the rate hike cycle from the Fed later on this month. And this all the meanwhile coming as the emerging markets are suffering. So all the more for this, this kind of economic outperformance of America when put into the context of the rest of the world, when it's such a kind of flashpoint of concern emanating out of the EMs at the moment. So what you're seeing then is, you know, this fits obviously perfectly for the political narrative that Trump's trying to spin, because if you talk about the real American firms defined by the small caps, well then it continues to push on while the rest of the world suffers. Another chart here, obviously this is looking now over into the Far East, and we know this story very well because over the last 3 months the Chinese currency has taken a battering. Actually, to give you an idea of the type of loss, just trying to find the statistic here, I had it written down for the yuan. We're looking at the country's offshore currency has depreciated about 11% against the dollar since reaching its high in March. So I'm referring to this point here. So this is when the yuan was, was stronger, and this is just looking at the Chinese offshore spot price and how, as this dialogue has continued to slowly escalate, the currency has got very close to that 7 marker. So, you know, significant weakening. Um, the weakness has helped to counteract slightly some of the US trade actions, because obviously as an export nation, a cheaper currency does help. But obviously it does bring about— if the currency was to weaken too much, then capital flight. People thinking it's getting to the point of a Turkish situation, I've got to start pulling out my cash and all of a sudden you get a run on the market that has to require large-scale intervention at a cost to then the central bank and the government, which China will be very much wanting to do as an option of last resort, one would think. Another chart here, this is looking a little bit more stateside, I guess. This has been one of the things that was a flashpoint again of activity a couple of months ago when everyone was kind of Putting together and connecting the dots about US agricultural goods, because if you think about what the US is, then it relies heavily on ags and soybeans, one of the biggest US agricultural exports to China that's been caught up in this tit-for-tat row with China. The commodity has fallen, soybeans, about 22% since April when the Trump administration said it would levy an additional 25% tariff on on imports of 106 US products, including the American staples. So obviously this is very critical as a key ingredient for then the feeding of pigs, and then for the kind of main base meat ingredient that's used by largest populous nation on the planet. So next chart I wanted to show you was this then, which is the emerging markets, which obviously is of course inclusive of China. And the MSCI EM index, of which roughly, to put it in context, one-third, one-third are Chinese and Hong Kong listed companies. And it's down about 20% since reaching the highest in more than a decade. So don't forget, back here in January where we really got off, got off the mark in the new year, the EM market was on fire. And then soon as this trade war started to kind of ratchet up in the rhetoric and the aggressiveness of the Trump kind of posturing, if you like, and action that has followed, the EMs have really suffered. And this fall has been substantial into more than 20% since that point. Now, one thing is then emerging markets, we know, are very important for financial markets right now and are likely to remain that case going forward, at least for the, the coming weeks. So what I found here was Goldman Sachs EM Macro Navigator. Now this was just a very useful infographic that I found this morning, and what it does is it highlights each geographic risk event coming up in the next few months. So obviously Brazil, we know is particularly a hot topic at the moment because they've got a general election, uh, which is happening on the 7th of October. You've got Argentina going through its kind of debt crisis and its need for financial assistance from the IMF and so on. You've got South Africa with their midterm budget policy statement in late October. This is a really nice, just quite clean snapshot because as I was talking to some of the newer traders that have just joined us and some of the interns, you know, when you're thinking about investment strategy, whether intraday to play the short-term kind of changes of the narrative in conversations, or a longer-term investment decision, you've got to weigh up the potential scheduled risks that you know are upcoming. And when people are very sensitive to EM developments, well, then you'd be remiss not to be aware thoroughly of all of the key pivot points of activity coming up over the next months. So certainly for any of the guys in the Trading Live who've been in the game for a bit longer, you probably want to make a note of these in your diary because these could be pivotal for short-term market sentiment as well as longer-term investment decisions. Okay, leading on, there was an investment bank research note following on from this subject that I saw this morning from UBS. and they're talking about, okay, we're talking a lot about the importance of trade wars, what's the— what is the trade here and what's the repercussion if we get an escalation? And UBS have come out with a note, and in summary they're saying the S&P 500 could drop 5% if the US levies a 25% tariff on an extra $200 billion of Chinese goods. And remember, this comment from the US could come today. Uh, and UBS say that's a scenario that has not been priced in the market, that 25% figure. The firm's economists expect 10% tariffs to be enacted by the end of September. So at the moment, um, sources have suggested that this latest kind of batch of tariffs from America could range from anything from the value amount being the same, $200 billion, but is it 10% or 25%? There is not a known figure. And so depending, then obviously 25% would be much more detrimental. And that's the situation of which UBS are saying that is not being priced into the market, and subsequently you could see a 5% fall in the S&P. Well, this is the S&P on a daily continuation. Let's just check out what a 5% fall would look like from the current price. Here we are. Let's scale it down to 5%. So we're looking at a fall back to, let's say, roughly this level here. So we're trading about 2878, so we're looking at 2731. Now that looks pretty punchy, obviously, comparative to the year or the week-to-week moves. This certainly reversed a lot of the gains that have been seen up to these kind of record territories over the course of the last 3 months, but you know, hang about, let's just put this in perspective a little bit. You know, here we are, we did just hit record highs only 2 weeks ago, or maybe less than that. And so a 5% pullback only puts us back to really the midpoint of the February volatility we saw on the fear about policy tightening and inflation concerns. So 5% is a punchy move, but 5% is not the end of the world, uh, in that respect. I guess it could be quite interesting. I just wonder if there's trend line as well, where that would take us to. Well, look, if we did fall 5%, could be quite interesting as well. That would bring us back to kind of that, that trend as well. So food for thought, certainly. But another interesting piece of analysis that I thought I would share with you, um, that UBS were certainly talking about this morning. And this is also something to consider. We're talking about here all the negative threats that could occur. Now, this chart here is basically a historical study of past election cycles by UBS. So this is looking at the performance of the S&P 500 around midterms versus all other years on an average basis. So this is quite important because we've got the midterms coming up. This is going to be beginning of November, and obviously this is a, yeah, of key concern to market participants because the importance of politics and Trump's policies and whether or not he can pursue such aggressive policymaking, or at least proposals, if we see a renewed composition on the balance of powers within Congress, i.e., the House and the Senate. A number of seats are up for grabs. The study here, and what's interesting, shows that after choppy performance in September, midterm rally begins in early October, and you've got quite a distinct here outperformance of midterm years, uh, comparative to all ex-midterm years. The outperformance goes on to continue through the year-end and increase at the, the start of the following year. So actually, although we might have thought, well, Trump might be ramping up the kind of America First policies which could be detrimental to the EMs in the short term, what the analysis back-tested would show is that the pattern, if it were to repeat, is that the threat of losing Congress seats prompts more market-friendly rhetoric. So, you know, just some interesting food for thought here about how these things, these might play out in the longer term. So that's pretty much it for, uh, the morning wrap of the news. I mean, everything's a little bit more, I guess, overview, global, macro-oriented, because net-net, the market's not moving this morning. We've had a couple of things that have come out, um, that I guess is worth mentioning but definitely not moving the market. German trade surplus shrinks to a 4-year low. So the trade surplus in Germany narrowing to its smallest level in more than 4 years as exports of slipped while imports jumped during a period of obviously not just the US targeting China but the US targeting Europe as well. I'm not sure why I keep saying China in a Trump accent. God, the guy's infiltrated my mind. But yeah, so this hasn't moved the market, but just goes to show that this is definitely spilling out and is a broader market concern, and hence trade rhetoric is the most crucial thing. And actually, I think if there is any commentary from Trump today, this far in my mind at least, given the right type of comments on the percentage values, if up north toward the 25% on this $200 billion, far outweighs non-farm payrolls. Non-farm payrolls is a flash in the pan for me and is, for anyone new to trading, an event typically worth avoiding because, as discussed with some of the interns yesterday, the comp— the complicated nature of the number of variables to navigate makes it incredibly tricky to trade. Not unless you get a, uh, a statistical anomaly where all factors are pointing in the same direction, which is obviously an incredibly low probability. Only then really do you get a more cleaner move in the market. From a payrolls point of view of what to look out for, of course it's the, the wage numbers with its kind of feed-through effect for people's consideration about forward inflation expectations rather than the headline creation of jobs, which ultimately is key. But I think you've just got to be mindful today could be tricky one because just imagine you get payrolls come out and it points to an inflationary situation which creates short-term higher US yields and stronger dollar, and then bang, Trump comes out with a tweet, 25%. So you've just got to be, I think, pretty realistic, I would say, with having positions open, i.e., a position of risk on on the table for headline threat of activity on the tweeting side from the president. Just from knowledge, and I don't have statistical evidence to support this, but from recollection, and obviously my job being to sit here and monitor these things, Trump does like to send a message on a Friday afternoon. He loves it. Absolutely. If he— if you can predict Donald Trump's behavior, nothing more he likes than sending you off for a good weekend, making you proud of America. And so how else has he been doing that more recently but talking up the kind of the war against China on the trade front? So if history is to repeat itself, I think there is definitely a tail risk today's session that could end in a negative way as a possibility. Just to finish, just seeing gold— or excuse me, oil— just breaking pivot, little run up higher to 68. So a bit of a reversal from some of the movement. I wasn't here yesterday afternoon, but I can only assume this was the infantry, post-infantry move. So you've already taken back roughly 50% of that move. We've just broken the Asia-Pacific range on the top and the pivot level, hence a little bit of extension of the crude move here. Okay, I'm not going to talk anymore. I'm going to let you guys get on. So just be a little bit realistic, usually erring on the side of a little bit of conservatism to approaching, uh, your trades to the morning is usually warranted, as people will await non-farm. And really, I think things are going to be a US-centric session for payrolls and potential trade rhetoric. As a footnote, there has not yet been a deal as well for Canada. That is still outstanding, and it doesn't look like we're going to get anything today. But obviously, if there were, that could be another interesting opportunity, uh, for the Canadian currency as well. Okay guys, have a good day ahead and have a great weekend. Thank you very much.
More from Anthony


Inside the Biggest Banking Stories You Need to Know This Week (Anthropic, Diageo, Private Credit)


Inside the Biggest M&A Deals You Need to Know This Week (UniCredit, GameStop, eBay, Eli Lilly)







AI Breakthrough or Hype? Anthropic’s Claude Mythos, Tim Cook Steps Down & LIV Golf Collapse