Morning Briefing - 9th August 2018
Market briefing covering currency pairs under dollar pressure, Brexit's potential 8% GDP hit, China's 25% tariffs on US goods, and a Canaccord analyst forecasting S&P 500 at 3,200 by year-end. Key technical levels flagged for EUR/USD, GBP/USD, and crude oil ahead of US inflation data.
Chapters
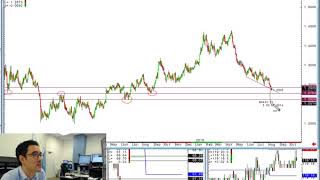
Okay, so very good morning, Thursday, 9th of August. Let's get things underway. And just giving you a quick overview, not a huge amount of groundbreaking news that's developed from the overnight session, but certainly a few points for discussion for sure. And just first off, looking at the charts as we can see them that I'm looking at here, we've got EURUSD cable on the top left corner, both subject to a little bit of pressure. Not so much on European or UK information, but more a little bit of prevailing dollar strength. The DXY at the moment has taken extension above the 95 handle, up about a quarter percent. So as you can see here, a bit of weight on both major pairs. EURUSD, just as I'm speaking, coming back down to close proximity to the low point that we had yesterday uh, afternoon, which could be an interesting near-term point of support to just keep an eye on from some of this relative resistance seen back at what would have been the beginning of the week, and then what we had from yesterday's session. And you got the 1.16 handle in the future sitting just beneath there, so just coming up for a test at that level. Cable as well having breached a kind of double bottom here that developed from the Uh, the decent move lower from yesterday technically in cable. I know Sam was looking at some of these charts here, uh, this trend line at the time when that broke what would have been yesterday morning, a decent move to the downside. Uh, we kind of formed then on a break of that S2 on yesterday's intraday, came all the way down to come back up to retest that level, and we pretty much traded the range there for the best part of yesterday. Had an overnight Asia-Pac test, the third real attempt, and we've broken through here just a short while ago. So an immediate run down to that S1 level. Just quickly on the pound, looking at the longer time frame, this is obviously something we were, we were looking at yesterday, this being the kind of gradual move lower that we've had and that trend line developing from late May of which we have now breached. And it was quite nice there, lining up alongside the 1.29 handle actually on that level, of which now we are below. And so from a broader perspective, this does— obviously, if I just reshape this chart slightly, it does encapsulate the drop obviously on the far left-hand side of the EU referendum, down to that low point that was seen in the, the kind of 2 weeks thereafter. Um, but looking downside here, technically from a longer perspective, uh, this is the 127.83 level, would have been the pretty much year-to-year point of where we were in middle of August to late August of last year. And so just interested to see now that we've got through these technical points whether or not that's the next target to the downside will be an interesting thing to have a look at. Now obviously quite interesting just given the area here, not only from August, but that was the key point of resistance which restricted the recovery that we saw in Q4 of 2016 for eventually hitting that very same level. So, um, post-e-referendum low, the recovery high from the December move from the Q4 recovery in 2016, and the low point of support from last summer So that's a really big level there if we would continue to move lower. And now we've got through some of those technical points, I don't think that that's out of the realms of possibility for at least to see a test down at that point, um, now that we've remained persistently heavy, just given the type of news flow we've been seeing about a no deal for Brexit. While we're on that subject, let's jump straight to what the latest is here on this particular subject. And this was a comment that came out just a short while ago. This is from Business Insider. And just for anyone who does follow the Brexit news flow closely and you are trading the pound, the actual Business Insider UK has been particularly good at releasing their own exclusive reports, and these being source comments, and they have been market-moving in the past. Now, this one not so much so, but it certainly gives you a bit of a flavor of the behind-the-scenes of what's going on. And the summary headline here: Conservative Brexit rebels will block Theresa May from crashing out of the EU without a deal. Now obviously this has all been initiated from this idea and belief that because of the Trade Secretary Liam Fox's comments at the weekend in the Times that the chance of a no deal has now gone to 60/40, and hence the reason why the pound has traded heavy since the commencement of this week. Now, I did send out in the morning research a document— well, this was the headline from Business Insider, so you can see it here. I did send out some research this morning which, if you are trading the pound, definitely I think it's worth taking the 5 minutes to have a read about what is the implications then of a no deal. And ING, our friends at the Dutch bank, have put together 4 charts which showing the risk of a no deal, but do importantly note that still their baseline scenario, and I would say still the baseline scenario of the market still on, on a whole, is that we will muddle through. And so although a no deal idea has picked up some pace, it still is the lesser degree, if you like, of probability of playing out. Here is though a couple of charts, 4 in fact, that ING look at. And first of which, of course, is the talk of a no deal has ramped up significantly following those comments I just mentioned. So quite often what people do is they look at the broader press and the type of story count running headlines of no deal. And you can see here from where we were just a few months ago, it has really ramped up as we continue to find the sticking points, obviously, on the, the border issue concerning the Republic of Northern Ireland and so on and so forth. Just to give you an idea by the statistics of what would a no deal be like percentage-wise for UK economic growth, well, leaked UK government forecasts earlier this year suggested that without a deal, the UK economy could be 8% smaller over a 15-year horizon relative to current projections. So So that's just to give you a bit of an idea. But some other subsequent charts that kind of reflect what a no deal would look like, and this one's quite interesting here because actually, despite the political uncertainties that we've had under the leadership of Theresa May and so on, actual employment in the UK has been particularly strong. And employment in the UK actually since the vote of the referendum in June of 2016 has gone up 2%. Now, if you look at this chart here on the left-hand side, you've got that improvement. 2% here is the orange line. Here we are post the Brexit vote. Then you've got the financial crisis of 2008, and then you've got the 1999— or 1991, excuse me— recession, which is obviously incredibly destabilizing from a point of view of the job situation in the UK. So what we've had thus far is incredibly different to the economic downturns that we've seen in previous big issues that have faced the UK economy. So whilst overall consumer confidence has though remained depressed, unemployment expectations remain very low by historical standards. But as time goes on, ING note that it's not unimaginable that a few dramatic newspaper headlines could see consumers cut back on further spending particularly if individuals begin to become more concerned about their job security. And we know that although we have more recently moved back into real wage growth, this is a very fine line that we've been treading. And with diminished savings rates and so on and so forth, a continuation or further decline in consumer confidence and remaining of spending in a service-driven economy could be highly detrimental then. And consequently change this employment outlook very quickly. The other thing, of course, is a no deal. What does that then mean for trade specifically? It's almost as if we can't get out of the remit of just talking about politics and the Conservative Party and its mismanagement of that, that we've not even— no one even discusses really the nuances and legality of trade. Which is obviously the bigger, more pressing issue if there is going to be a Brexit deal. There's no doubt that a no deal would create significant disruption at the borders, and an obvious point of contention here is Dover, because much of the trade with Europe is done via lorry and the Channel. And if you remember the stat before from what analysis was suggesting, that even even just a 2-minute delay at the customs border initiated at Dover would create a nearly 30-mile continuous, continuous backlog of lorries every day all the way up into the motorway in Kent if that was to be the case. So hence the reason why keeping a frictionless border is absolutely pivotal for the, the functioning of the distribution chain, because that's the other key thing. ING note that 70% of the UK's marine trade with Europe is spread across no less than 9 different British ports. Delays at any of these terminals could have serious ramifications for supply chains on both sides of the Channel, as well as the smooth running of northern European ports. So in summary then, What would happen if these supply chains are severely disrupted? Well, that's going to impinge the supply of goods and the prices are going to soar to the upside. And in a world where consumers are unconfident and already pushed— household incomes have been squeezed post-referendum— this could be dramatically destabilizing then for the UK economy. Of course, the other thing in the final chart that they look at here is the tightening of financial conditions. And things have been so good so far, but a sudden elevation in uncertainty could spark quite a severe period of risk-off, which could lead then to credit spreads widening and a pickup in volatility, uh, and so on and so forth. So the final thing, of course, is what would be the prospect of the pound. Now, just quickly looking at the pound, you remember we were looking at— I think Sam was at the beginning of the week There was Crédit Agricole, kind of batch of other mainstream banks that were making calls about what does a no-deal Brexit mean. Well, let's just have a look if percentage-wise, if I just get a— so if we were to go from where we are at the moment, a lot of the calls were talking about 10% decreases. And certainly the big level that you'd be eyeing in that situation, if there was going to be a no deal and if it was going to materially head that way, of which I think certainly there's a lot more worse to come than that 1.2052, obviously the, the real defined level of the post-referendum period, that's the really big one. And 1.20 Could we get down there? Well, really what you need is that these self-imposed deadlines— I think with this October, which is now the goalposts have moved to November for Theresa May's white paper to really be accepted by Europe— I think that's gonna be difficult. And what's happening here, and I think the reason why the pound has remained heavy all the way since that, you know, it's incredible to think there was only a few months ago we were up at 1.45 and here we are down sub-1.29, is that I do think there's more pain to come for the pound. The big, big obstacle downside is that 1.2783. As I mentioned, technically, if we get beneath there, then I think there's certainly— we could get to 1.2625 over the coming weeks for sure. A breach of that certainly then does open up quite an interesting technical kind of gap, if you like, to the downside. All of this, though, would be contingent that we continue to remain at an impasse and nothing is getting done all the time amid a stop clock, if you like, which is counting down to Article 50 lapsing in March 2019. So although I definitely would be a buyer of the pound at a certain point, I do think there's some more pain to come for the currency at at this particular point in time. Now, a lot of people say, well, a weaker pound is good, right? Weaker pound lifts the FTSE to record highs. And that has been an inverse correlation, which certainly has, has, has been at play. But ING do note that sterling's likely plunge on a no deal, while the theory says that it should help cushion exporters, they say they're not convinced given the complexity and globalized nature of supply chains. The impact of border friction on just-in-time production is likely to far outweigh changes in pricing for exporters. This means the primary effect of a weaker pound will likely be sharply higher prices for consumers. So again, impacting consumers, impacting companies, impacting the economy as a net result. So a couple broader things just to be aware of. to have a look at. Okay, going back just quickly though, a few other things I just really wanted to run through just to get you up to speed. And this is one. This is a picture of the Kiwi dollar. So overnight you had an interest rate decision from the Reserve Bank of New Zealand. They kept interest rates on hold, 1.75%. However, they did push out its expectations for a rate hike to the third quarter of 2020. That's quite a notable shift in their preparation of a rate hike. I think that's actually pushing it out by a near year amid a weak economic growth outlook, which they suggested in their accompanying commentary. So quite a bit of significant weakness in the Kiwi has had a little bit of a feed-through, I guess, in terms of the Aussie at the time, but hasn't really managed to sustain any type of read-across move into the the Australian dollar. But Kiwi, a little bit of movement from overnight. Overnight in China, a couple things to be aware of. Of course, China retaliating in kind, saying that they'll impose 25% tariffs on an additional $16 billion. This is just following suit from what the US have done. That's going to come into effect on August 23rd. Now, the reason why the markets on the charts are fairly calm on these trade issues is for the moment all of this is priced in. China saying they're going to do 25% tariffs on $16 billion worth of goods is absolutely what they've been saying for a number of weeks. So it's absolutely in fitting with expectations, hence the reason why markets have not particularly nervous about that type of commentary. One thing you did have overnight though in Asia, just so you're aware, Chinese factory inflation holds up as consumer prices gain. So factory inflation held up in July even as commodity prices eased. Consumer prices gained slightly. So this is what the chart looks like. Again, nothing really spectacular here that's going to cause people to become particularly renewed interest in Asia as a risk. These data points fairly consistent, as you can see here, the price patterns that we've seen throughout the year. A few other things From an equity earnings point of view, specifically for the DAX this morning, you've had Adidas come out and really no surprise here. The World Cup obviously boosting their clothing sales and they exceeded expectations, growth in America and Asia. We've had Deutsche Telekom, one of their biggest telecom providers, raised their forecast on the back of growth in the US. This of course comes amid underscoring their planned deal to taking over of T-Mobile's unit to buy Sprint. Corp. And then ThyssenKrupp, slightly more upbeat. A German conglomerate facing pressure from activist investors reported a loss at their industrial unit. How much of an impact is this having on the DAX? Very little, to be honest, in terms of a directional move. Uh, the DAX has been relatively quiet. I think one thing to be aware of from an equity perspective, and overall this week has been quite quiet. I was reading a few stats this morning about the low level of, of price movement by percentage in a lot of the US indices, uh, and so I think you've just got to factor that in for the rest of the session as well. I'm just looking at the S&P here, and on the downside, as we've consolidated really around this range over the last 2 days. This is still the key area to be monitoring. So from a downside perspective, I think this area here of support is going to be quite key and influential, and I think, of all things being equal, will most likely hold. So if you're looking at a range play, potentially for them to move to push back up higher to the, the extremity of the upper bound of that range from Tuesday, Wednesday session 62.5. Now start looking at that on a daily continuation chart. Again, this is just looking at that same kind of setup here, so that lower bound of around the 2850 mark, which brings into play that kind of late July price high as well. So now we've got above there, be looking for that to provide some support, because at the moment the markets, I think, still seem to have this feeling of wanting to just drift up higher. And obviously we're in quite close proximity to the all-time highs in the S&P. So it goes to show the risk appetite, irrespective of the trade risk, albeit a tail risk, because at the moment it's not really escalating to the point which is causing a greater concern, which having gone through earnings season is showing fairly robust corporate earnings growth and also rising confidence. Here's a headline this morning And one of the biggest bulls on Wall Street, which is a chap from Canaccord, uh, Tony Dyer, who's saying that US equities flirting with fresh all-time highs. He's doubling down on his view, recommending the S&P 500 is going to soar 12% in less than 5 months. So upgrading year-end call. The average on Wall Street is, you know, just to be aware of this, from I heard mentality and a broader consensus point of view is that by the end of the year the S&P is going to be higher than the all-time high of 2878.5, just shy of the 3000 level. But this chap now is looking for 3200 by year end. So there certainly is some big bulls out there who are still looking at the fact that earnings driving the next leg of the bull market a reset of global expectations and demographic tailwind will also fuel a second half ramp up, he says. So, you know, there's still some of a belief that although it looked like we were kind of reaching a bit of a peak, that there could be another squeeze higher. I guess all of this contingent, of course, about the trade negotiation going forward. Okay, quick look at the calendar then. And before I do that though, I did want to have a quick look at oil because we've got a new group of interns in with us at the moment, and, uh, they saw the WTI or the DOE crude oil inventories for the very first time. And obviously some of the questions that came were How do you approach trading this type of data? Now, what I think was one of the key things here is that trading the initial data itself can be awfully tricky given the multiple variables that you need to monitor, can heighten the degree of volatility certainly in the initial aftermath of the numbers hitting the tape. Now, what's interesting here was that the move developed over the course of the late European afternoon. And so, you know, this is it with the oil inventories. It's not necessarily you're having to be uber aggressive and looking to hit market. The move happens in phases, and often that phase can come in and the move can continue for half an hour, hour, or in this case hours thereafter, where the best, or at least easiest in terms of management of the trade and execution could come later. So it's just about being patient, I think, a lot of the time with this particular data. Now, what was interesting here was that on the initial move of the data, you'll remember you had a spike lower. We had a drawdown of 1.2, 1.3 million. This was far smaller drawdown than the 6 million APIs. So we fell, but then that US output was down 0.92%, which is almost double the kind of average increment over a longer period of what we normally see from a percentage change. And certainly big drops like that are quite uncommon. And so we saw a spike back up, but then the prevailing move was back down. And so again, identifying just these key levels to the downside as to where then next could the price movement go is what's particularly key. So the market does tend to respond very well to these technical points when you're looking at trading this particular data, because people are trading the momentum, the kind of fast money moves. They're looking at best and most opportune point of exit when they're in the short. And so you can see, if you were looking at this on a much longer data candlestick, but a more closer defined timeline, you know, the market really does respond on these previous levels. So ahead of time, it's about doing your due diligence, identifying those, looking at where is going to be the points of which the market's going to look to exit. And no surprise at all to see the extremity of that price point where then you had quite a bounce back in prices at the time. Here was when we hit that exact low, so people just booking profit, and we saw a decent or almost 60, 70 cent bounce to where we were, but we are still remaining down towards the lower end of this range. So for today's session, for sure, I would be interested to just keep an eye here on that low point. So this type of area here, if we get down to retest that, then obviously we are trading the lowest levels we have done in several weeks. So it could be quite interesting. Now, the data was pretty mixed, but obviously there is this trade war situation the impact that could have to global economic growth concerns, and as a net result, demand for crude. Uh, all these things in play with obviously things like the OPEC agreement of extension of crude output also. So oil definitely is worth keeping an eye on that lower bound price point, uh, from yesterday. Similarly, what looked very interesting was RBOB gasoline. Now just looking at the futures here of gasoline, we are as I speak, and I would be looking at this in tandem with trying to gauge the momentum of any downward movement in oil. We're testing a key level here, so that low from yesterday post the infantry data is having a look at right now. And if we look at this on a broader time frame, there are some quite interesting levels. Let's just have a look. If I tidy up the chart, you can see how for Arbob Gasoline here, this $2 mark is really quite pivotal, as you can see from where we were back in June, from July. So any breach of there psychologically on the 2 as well does become very interesting. The next kind of key, more level of clear technical relevance not coming in until quite a bit further down. So could today be a day where we see some further coordinated pressure in the energy complex, and could then as a net result, if that does start to build up some momentum and size, start to translate into just capping, um, some of the gains, at least for the intraday in the equity market, if it weighs predominantly on the energy sector once the US gets underway? Could be something to just bear in mind. All right, calendar-wise today again is very quiet. So from a UK European economic data point of view, not a great deal going on. You're going to have to wait until this afternoon. But in terms of initial jobless claims, I think, look, again, unlikely to be market moving as per usual. Tomorrow is the big one for the US economic data slate. It's US CPI. But front-running that today, we get the PPI final demand figures. it's going to be at 1:30. Speaker-wise, Fed Evans, but isn't on voter, uh, that's happening at 3:30. Okay, that's your brief. I'll let you guys get on with things, and I'll see you in the chat room throughout the day. But have a good one and take care. Thank you very much.
More from Anthony


Inside the Biggest Banking Stories You Need to Know This Week (Anthropic, Diageo, Private Credit)


Inside the Biggest M&A Deals You Need to Know This Week (UniCredit, GameStop, eBay, Eli Lilly)







AI Breakthrough or Hype? Anthropic’s Claude Mythos, Tim Cook Steps Down & LIV Golf Collapse