Stocks Crash As Markets Set For Worst Week Since 2008
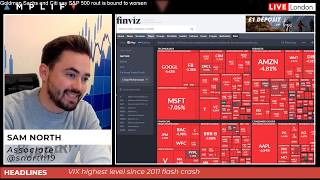
Sam and Alex break down the market crash on February 28, 2020: the Dow, S&P 500, and Nasdaq all fell double-digits, the VIX hit its highest weekly rise since 2008, and it was the fastest 10% correction since the Great Depression. They map support levels on major indices and currencies, emphasizing risk control and technical discipline over headline-chasing.
Chapters
Hi guys and good morning. It's Friday the 28th of February, coming to the second last day of the month. As you can see, I've got this new hat here, a little downgrade, Dow 25,000. Get your hats, anyone that wants a copy of this. Please do get in touch. As you can see here, going very, very fast off the shelves. Quick look to my, well, right-hand side, and you can see just how bad it is. Sea of red yet again. 6th day in a row. Stocks, you know, it's not looking good here. I mean, spot the green. Look at that. It's just absolutely incredible, really is. It's got people talking about markets. Yeah, you know, these moves that we're seeing are just really incredible here. Bringing the, the S&P in here now. Let's just have a look as we go for that European Open. Just gone 8 o'clock in the morning. Another leg lower yesterday. We're having a slight little bounce here, and these moves, you know, just off the bounce, off the low there, it's done 35 points. Just off the low in the Dow Jones from early hours this morning, it's done, you know, 400. You know, these moves are a lot bigger than what we've seen recently. So, you know, first things first, be careful out there. You know, identify your levels. And I want to take this briefing as a really, you know, in how to trade the coronavirus, how to trade these markets. And there is great opportunities, but of course the most important thing here is to, you know, to control that risk. You know, I was here in the office yesterday until— what time did I leave? About 7 PM. And until I went to watch Arsenal, and believe me, I do regret that, as we conceded the last-minute equalizer— well, loser. And I was just identifying it, and what's been fantastic about these markets in the last few trading days is once they have, over the course of the trading session, identified a key level, And in the case of what I was trading, the Dow Jones, it was, say, the previous low of the day. Um, it, it really does respect it well, and it acts as a good line in the sand. Above there is an opportunity to buy, below there an opportunity to sell. And also, just before here, you've got the, the previous low of what would have been Wednesday, and you can see that just held up as a great level. Now, of course, what's going to happen as the volatility picks up of these markets your stop losses, the size may have to be slightly bigger, but you can always downsize because these moves, you know, considerably bigger than what we've seen 2-3 weeks ago. Anyway, that the trades you can see here on these levels, we finally got that, that 5-minute close below, and that for me is very key in these things. I wouldn't necessarily have orders waiting to get into the trade. Wait for that confirmation, you know, price breaks through, and it wasn't until, like I said, just about around 6:50, 7 o'clock that I got into that trade. Price I identified here as a level of support and then had a target for what was the low of the day. And then we're sitting around what had been 9:45, checking the Amplify group chat, and Alex and Charlie are saying, have you seen what's going on in US stocks? They're down XYZ, over 1,000 points, 1,400. And I'm thinking, 'Oh, this, you know, why did I put a target on there?' But you never know how far, you know, this is really going to go here. And it continued through the night, um, the, the S&P, its fastest, uh, drop of at least 10% in, in history, uh, its 6th straight day of declines. Uh, the broad market has lost an average of 12% since hitting just a record high on February the 19th, literally 10 days ago. We were at record highs. Dow Jones, uh, fell as much as 12.9% from its high, and the NASDAQ has lost as much as 13%. So in correction mode here. And you can see a lovely little graphic here from the Financial Times just on my right-hand side. Virus tips S&P 500 into quickest correction since the Depression. So you can see here the only two ones that have beaten this, this 10% uh, you know, from that, the high September 7th, 1932, and July 18th, 1933. So massive, massive move lower. The, the Fed funds rate, well, so I was having a look at this earlier, uh, 81%, I mean 100% priced in for a cut. Um, now I've got my, you know, my view on this, and I, I feel Twitter's sort of on my side here as well from just sort of pointing out, you know, a couple of points. Should the central bank even cut here? I mean, I think it's— is it really gonna, gonna change things at all? I'm, you know, I'm not too sure. Um, I think over the weekend, you know, it's— I— my word of warning is I wouldn't hold a position over the weekend unless you're medium term, got a fantastic trade that's going well, it's de-risked, it's completely now risk-free. There's a complete— there's definitely a chance that this market could gap either way, you know, on, on Monday where, you know, central banks all come together and they come up with some, you know, sort of plan to, to reduce this massive downfall in stocks that we're seeing. Um, in terms of rate cut, you know, I'm not too convinced that that's the, the answer, uh, because they're so low anyway. And if, uh, you know, if data was eventually to get— start getting better down, down the line, what they weaker down the line, I should say, following all of this. And how low can they go? And then it's negative interest rates in the States. And I know Donald Trump wanted that last year, but you know, that for me would just make no sense at all. But yet here you can see it's priced in 3 for the year. Also another good, good graphic here. You can see the weather— bottom of my headline here— the VIX index hits the highest level since 2011. Crash. Here you can see the, the fear gauge, the Wall Street's fear gauge, the famous VIX, on track for the second biggest weekly rise in history. The only one bigger than this, October the 10th, 2008. And you know what, can we beat— can we beat that? And obviously it's not a competition, but you would be, you'd be brave to bet otherwise. Some of the new cases overnight— let's just go back to the charts and have a look what's going on in the open just while we do this on the, on the DAX. Here you can see relatively choppy in that first sort of 15 minutes. It's gone through 16 minutes now. The new cases, uh, South Korea overnight 256 new cases, and that's just been updated recently to 315. China 357 new ones with 44 deaths. Um, Italy 603 cases. Germany 14 new cases. Uh, they're ready for, uh, the epidemic, uh, and, uh, also first cases in Northern Ireland, New Zealand, Lithuania, Nigeria, and Belarus. It's spreading. And if they start testing— I mean, what really kicked things on yesterday to the downside in stocks was the— that they were testing 8,000 people in California who had got back from Asia. It was that squawk came out and price went lower. And a massive, you know, shout out to, to News Squawk, the squawk before provider we use, the last couple of trading sessions they've been massively on the bull. If we go back to around sort of 4:30, 5 o'clock on Thursday— Wednesday, when they reported what the, the German Health Minister said, you can see stocks have never gone lower from there. And you had time to get in here and the market moved. So it is, you know, the way I would say you need to trade this, you need to identify your key levels, and also you need to realize that this is going to be a headline-driven market. What's going to push us higher is probably people taking profit and just a bit of relief until we come back to these key levels where decision needs to be made for this move lower. So what you can see certainly over the last few trading sessions is any false break or any, uh, attempt to getting to a previous low, uh, has just been met with a great opportunity to get short again. So while I say, you know, here for us to get to the pivot in the S&P, that would mean, you know, we've got to be up for the day, and we'd also have to 80, 70 points higher. I mean, what an opportunity that would be to then get short later on. And these markets really are moving. The Dow Jones had a range yesterday from that height that it made in, in early trade to where the low now, for example, of nearly 2,000 points. You know, have patience and wait for these key levels to come in. If I was looking for, you know, a trade, I'd be looking and identifying just how key this level is here, 25,520, yesterday's low. We could not close below there on the 15-minute candle all overnight. When we did at 3:15, price came back, great opportunity to sell. So whether you've got a bias— and it's always risky coming in with, uh, you know, necessarily a bias, did the market tell you what's going on? 25,520 for me is a great area where if we were to break above that 15-minute come back, that's a fairly good opportunity to, to get in. Or it might be later on. I'm not interested in buying, I'd rather see us push higher, fine. But then when we're back below there, that's then the opportunity to get in to the downside. Also, these lows here, you can see we've just created a really nice level of support on 25,200. It might be that we never make it higher, we come lower, and this is the next step that I look to, to get into this this trade. So there is very good opportunities out there. On a market that has definitely confused people is gold. Now it's pretty much now flat for the day, uh, over the course of— what day we're talking— Friday, Thursday, Wednesday, Tuesday. It's very range-bound. We've had bigger moves, quicker moves to the downside, and people just can't understand quite why that would be. Now It's— there's smarter minds than me out there that have absolutely no idea, believe me. Um, so it's, uh, you're not alone if you're not too, too sure why this is happening. But I've got a couple of charts that may shed some light. If we go back to— I might have actually just got rid— here we go. So back in the crisis 2008, gold actually didn't you know, go up massively like you would have perhaps expected. Now, this was also due to a bit of dollar strength coming in, but also you can see here really from 2008 into, you know, sort of July, September time, October, when it started, we actually did push lower. It wasn't until the end of November where we started to actually start pushing higher and higher. So it's not guaranteed at all in these markets that gold is definitely going to push straight away. And what you've got to realize with how stocks have moved. They've come down so quickly, uh, that people are going to get margin called. People are going to have to, uh, you know, take that money from their gold positions to put elsewhere as well to, you know, protect these moves. And of course, we're coming to the end of the month. There's going to be month-end rebalancing here. Now, do I think that gold can rally? I do, but you've got to be careful. You know, there was a couple of times it came above here and just couldn't quite break above those low— those highs that we've had for the Tuesday, Wednesday, Thursday range, and we're back down to those lows now. It could absolutely break lower, it could break higher. It's that confusing that I wouldn't really fancy trading at the moment. The cleaner moves, more understandable moves, are coming in equities, especially if we've got, say, new headlines that have come out. Um, also, I think it's, it's worth noting— I'm going to bring in the S&P here from, uh, 2008. And the reason I'm talking about 2008 is people are talking about the recession, it could be worse, this is a supply issue, it's nothing to do with, you know, what the, the central banks can do in terms of money easing, it's going to be worse. And, you know, the amount of days where we're now lower in the S&P— let's just go to today where we're trading— 1, 2, 3, 4, 5, 6. This is the currently the 7th. Back in 2008, 7 was the most we had. There was no more than 7 down days in a row, which is incredible. You know, here back in, uh, the sort of the first week in October, obviously we know Lehman Brothers collapsed on, I think it was the 10th. But here you can see 1, 2, 3, 4, 5, 6, 7. There's never been 8 in that 2008 period. Well, of course we did drift lower before finding a bit of a bottom on March 2009. There was no more than 7 down days. So it's incredible, this move. I mean, to look at these sizes here is absolutely just insane. The 200-day moving average yesterday, there was a point where— I'm just going to bring this on— where people were, you know, getting excited and thinking, well, this, this is suddenly, you know, we're going to find a bottom here. Let's go to, you know, this sort of 3047 area, let's call it. Uh, so yesterday was 3047, you know, is, uh, one second. 30, 47, uh, around yesterday. So here you can see this is where the 200-day moving average was. Strong push. And I actually tweeted out at this time, I said honestly, the way this market was bouncing from then, it wouldn't surprise me if we, if we ended up going green. And we are about 15 points away around— what's that at its highest? Around 5:30. The California headline came out that they're, you know, testing 8,000 people, hence the need for that swarp. You have to have that. Twitter is fantastic as well. And since then, we've, we've just come lower. So technically, we couldn't break above yesterday's low on, you know, saying this yesterday. One technical reason, the headline coming in as well. We then broke through what was the previous low of the day, came back to retest it, and then we've just pushed lower since then. So it's that fundamental, it's the technical analysis linked in together, which is how you want to go about it. But if I was trading, say, the S&P today, the way I would do it, I'd identify my, you know, areas of interest. And this is really what I'd be looking at, to be honest. So obviously the low of the day, 29,000, uh, 2,900. Then you've got this incredible area— support, support, support, support. When we break through, how's your resistance level? If you're up trading 4 o'clock, it's a fantastic trade. You've just made 50 points. You've done for the weekend already. Now if we get that level, so I'm very interested in what happens here. 2981, the same, and then the pivot up at 3006. What happens in between there, unless there's a new headline that comes out, I'm not interested. You can see just how choppy these markets are in between those key levels. Have the patience and wait for them because this is where, from these points, as long as you get your confirmation you want, and that could be the 5-minute close, it could be that you're looking at your different moving averages It could be that you're looking at the correlations. I mean, at the moment we're not interested right now in what gold is doing when correlated with the, the S&P. I want to see what T-notes is doing. I want to see what the Bund is doing. If we bring in just quickly here, uh, let me just bring in the Bund, uh, T-notes. Sorry, you'd imagine that we're just coming down a bit because S&P is rising. And there you go. So now we're coming up to this level in the S&P S&P is resistance, R1 on the T-notes is support. And you know, if you're looking for that correlated move, the volume of course is not necessarily as high as for these, uh, US markets. But as a guide, this could really be, you know, something that you're looking at. It could be that if the T-notes start to find support here, the Bund starts to find support on its R1. You can see also there that actually this level 2952 in the S&P is a great place to look to get short. Or vice versa. I would say wait for your confirmation. It's better to be slightly late than too early and get stopped out straight away. But overall, you know, these markets are moving fantastically well. There's, you know, really good opportunities out there, but you do still need that patience. Identify your levels, plan everything before, and also accept when you're wrong. If I was to say get the confirmation I wanted on this 2952 I'd have my stop, say, you know, give me the volatility's there, maybe 6 points above, 5 points above. And if it hits that, I don't want to— I don't want to be in this anymore. Because you can see when these levels, you know, in the S&P on that 200-day moving average, say you went short on the previous low of the day, it's gone and then rallied, you know, what's that, nearly 70 points. Stops have to be, you know, placed here. But while you're in the trade, identify when you don't want to be in the trade and they have it and accept that before. So yeah, incredible, uh, at the moment. So just to summarize some of these points here: Wall Street, the VIX, uh, second biggest weekly rise, uh, in history. Only 2008, October 10th, has bettered that. We've still obviously got today to go as well. Also, um, the biggest 10% correction from all-time highs that we've had since 1932 and 1933. Having a look at the calendar, um, it's— there's stuff out. If this is a normal, normal day, it'd be one where you'd be pretty excited seeing this amount of stuff on the calendar for potential opportunities. But the market's not going to care about this data right now. If you have really good data, you might get a slight bit of blip, but it's, it's not enough that's gonna, you know, change the course here. We do have quite a bit out around 1 o'clock. CPI numbers out of Germany, personal income US 1:30, core PCE, GDP out of Canada as well, before Michigan sentiment data at 3 o'clock, Chicago PMI around there as well. We've got some speakers. It's a day where you want to identify your levels, be aware that there's head— it's going to be a headline-driven market as well. And listen to comments as we go into the back end of that week. Is there going to be any emergency procedures overnight? Turkey, uh, have issued that they're going to ban short selling like China did a couple of weeks ago. That did boost the market. If America were to come out and say something like that, this is going to see a short rally. I don't think it lasts, but you don't want to be short when these kind of things come out. We've got 3 rate cuts priced in, so any talk of a rate cut happening at the next meeting isn't going to move the market because that's priced in. And look what's happened even with free priced in— these markets are going lower. So it's got to take more than that for this to be saved, I would say. Now, you know, there's a lot of people— and there was, there was talk yesterday of a vaccine being sorted within 3 months in Israel. A lot of people saying this is incredibly bullish. Stocks finished on their lows yesterday. You know, this is what's, what's gripping Wall Street at the moment is just this fear that this, this, but this virus is just gonna continue to spread. And unless they can really contain this, I do feel that the volatility is that going to be there, and you've got to favor the downside. But we have had 6 down days in a row. We only had 7 back in 2008. So really, it is a pretty incredible atmosphere. Fear out there at the moment. One other market I want to talk about before, uh, passing over to Alex, who's going to go into the dollar and the moves that we've seen and levels to be aware of. Uh, oil has continued to push lower, and I'm just gonna bring this on the weekly chart. We talked about this importance of this trend line, uh, from the 2016 low. I mean, it's just been relentless after it broke that. You can see just how clean that was. Also the lows of the year, and we're almost down at $45. And I mean, you, you don't necessarily want to catch a falling knife, but $42.62 is an incredible, incredible area of support where if we were to, to have another incredible move to the downside, is that a great opportunity to buy. The, the— what I was, when I was saying to people yesterday, and I've got people that are interested in sort of getting in these markets on these lows as great opportunities rather just be late. You know, if we can go back to above $50, yes, you would miss the $5, but also if we can technically break above that, you know, that is, you know, technical— technically quite bullish for a push to the upside. As you know, people will know I've been one of the most bullish people out there over the last few years whenever we've had moves lower. But for example, when I bought the dip back in 2018-19. It was only, you know, once we had technically broken higher and given that cue, and also the Fed were becoming dovish. I'm, you know, do think, you know, these, these moves lower, fine, it is what it is. Trade war is going to be fine. I think the Fed will do what it takes, so it's not enough of a bigger reason for us to go into recession. So where can I technically get in? How about above this trend line? And then we push on. Now we've got a real, real reason why markets are are under pressure here. So if I were looking to buy the dip, because absolutely people will be looking to do that, well, for me it's, it's a long way from that unless something fundamentally changes and there is a vaccine that comes out. And, you know, the talk is that these things take at least a year. You know, technically, how I'd be looking at it, I mean, maybe I'd be saying if we can get back above, you know, 3,000 in the S&P minimum but to be honest, I'd say really more 3028 and this trend line. Then for me, that starts being— well, for us to be up there, something good has happened, and then it's the opportunity to get in, uh, to, to the upside. But overall, the, the score for the day, obviously stocks expected more volatility to come. Identify your levels, strict risk management, wait for your confirmation to come in, definitely get that walk on or your Twitter headlines, because what's really moving these markets, uh, is just these further developments of cases. If it continues to spread in America, it's not just California, it's New York, this market is only going to go one way. But still wait for that confirmation there as well. All right guys, I'm going to pass you over to, to Alex. He's going to go through, uh, the some stuff on the, the dollar index and looking at Euro and cable as well. So I hope you all have a good, good weekend. I'll be on shortly just after Alex to wrap it up, but I'll catch you all in, in a moment here as well. Let me just bring in TraderView. Alex, over to you.
Good morning. Thank you, Sam.
Right.
Come on, this TradingView. Yeah, first of all, um, I have to apologize for guys on Trading Live chat room because much of what I'm going to say I said yesterday. But, um, you know, my style is to stick to my edge no matter what's happening. Um, I did a tweet the other day about volatility, sort of like a fly to a light. When, when things start kicking off gold spiking and when the stocks are plummeting, you know, we can sort of get distracted and we can get— go away from our edge and start dabbling in markets that we're not familiar with. And, you know, and that's very dangerous when that happens. It's just— and so I stick to the euro and I stick to the currencies. I'm just going to sign in here. Bear with me a moment. So yesterday it is— there is some volatility in currency land. Yesterday the euro had its biggest day in, in quite a while actually. And what I'm going to share with you first is how we caught the bottom in the euro recently. You remember the last 2 weeks price was falling and falling and falling. We fell from, you know, we were short up in this sort of 1.10 area, taking it all the way down through the sort of back towards this 0.850s. And then we, we had this— this was the longest period of consecutive down days in the euro for quite some time. But around the 0.8 handle, we were quite— we're getting quite bullish. And actually, remember, I think we were taught— was it in the briefing or it was just to our in-house guys? We had this, uh, started forming this base where price is no longer moving down and price is beginning to move sideways. And it wasn't an exact price, it was an area of support. I like to— rather than exact price, I like to draw area to get— I can operate in. And you can see this, you can see this hammer here that we had, this hammer with a really long tail. Um, we started to get a bit of a range here. It's very choppy, it's quite difficult But this was a hammer. This was the money shot. We was in the— we was in this range. We come back down again for another test of this range, but we held this sort of 0.8, 0.785 area. We smashed through the top of the range there, really strong extension up higher. Then the coronavirus— this was a Monday— this gap down was the coronavirus. And then we found support on the top of the range, broken resistance, now turned support. And ever since then we've been moving higher. And then yesterday we had the really big move. It was up over 100 pips yesterday. And so there are things going on elsewhere. Now, we yesterday, we sort of tested the 110 handle. Uh, we was up over 100 pips on the day, and it's been a while since we've been up over 100 pips on the day. And so big trades there in the euro. The monster trades are back. I would just like to quickly talk about fundamental bias. I had a strong fundamental belief that this coronavirus was going to get worse. I did some research over the weekend that from on— in late Jan, on Jan the 20th or whatever, China had 250 cases of coronavirus. Now, 2 weeks later, that had increased to 10,000, and that's when the yuan started weakening, etc. And so Italy on Monday had 400 cases, and so 2 weeks projection out takes us to mid-March. And if, if we see some sort of exponential movement from 400 up to 10K in Italy, that would be exactly the same as what we saw in China, bearing in mind that we can't actually believe what the Chinese— the Chinese statistics. If we did see some sort of growth, that would be I would have thought that would have been escalation and you would have seen European assets come under heavy pressure. But there's a lesson here as well in not to get too attached to fundamental belief because the chart disagreed with that completely. And in fact, looking at the chart very technically, you will know that over the last sort of month or so, we've been looking at this key trendline support. You know, I'm staying open-minded to the fact that this coronavirus could get worse. But I am very open-minded that actually price doesn't care about the coronavirus at all. If we look at this monthly timeframe, we've got this month— we've got this trendline support here that's 20 years old, right? And it's the grandfather of trendlines. So grandfather's coming to play, and you can see that technically this was back in September, October time, looking at sort of using Steve Neeson's candlestick, um, rules that this bullish engulfing candlestick pattern here, the very low of the candlesticks would have been support. And I'm okay if price can come below and test the support, but I'm— but price has to close above it. It's a monthly chart. How oversold we are on the monthly time frame. Last time we was this oversold was back in January 2017, which preceded Macron's rally. And when PMIs were ticking up Macron was, you know, beat Le Pen, and we had this rally of over 1,000 pips, right, over the course of about 12 to 18 months. Well, here we are, we've got this monster hammer here forming, which will close tomorrow— well, which will close today. And this is very bullish sign off of this monthly support. And so this is what the technicals are saying, and my edge is technical. And so rather than get married to these fundamental beliefs, I have to say, well, I'm starting to get very bullish the euro. And again, on the weekly chart, we're very, very, uh, oversold down here. And I think that— how can the weekly chart benefit intraday trading? Well, the biggest intraday moves are going to be in line with the trend, you know. And so if the fun— if the, if the big picture, if the tide is rising, all the boats, all the little— all the boats lift up with the tide. If the tide's going in the bullish direction, then I want to be buying these big rallies. The little pullbacks I'm not interested in, you know. And so that's why I focus on the, on the big picture. So it looks even better on the futures. I'm actually going to remove all these, but we had this hammer here last week. This, we closed as a hammer, which is a bullish sign off of trendline support. We've got this massive weekly candle here. We're very extended. It's a bullish morning star pattern. Now these morning— here's an evening star pattern, price move lower, right? Here's an example of a bullish morning star pattern, price move higher. And again here, bullish morning star, price move higher. And here we are, this one's more extreme and we're a bit more over— more overbought here. So in the short term, going into next week, looking at the daily, you know, we're just finding a bit of resistance at the moment. We're short-term overbought on the daily. We found a little bit of resistance up around this 110 handle, around the Fib 50 from December high. And so I would expect a little bit of just to pull back in here a little bit, back towards the 0.950s kind of area. I would have a— oh, I would have— excuse me. I'd have a fib drawn from the low to the high and a little bit of a retracement into next week to go long. Actually, I'd really like to get long this market. And fundamentally, I've got to wrap things up. I'd pay attention to Bundesbank speakers. You know, the language has changed from thinking about doing fiscal spending to planning to do fiscal spending. I think that might be a big part of, of this move. Um, hopefully we can get a big rally back up towards the 112 handle, which is another 200 points away. Above that, 114s. You know, if we can really get some momentum going here— momentum's been sucked the last 18 months— if we can get some momentum going here, you know, we could really break out, I think, because that, that monthly support is such a big area. I was going to cover the pound, but I can leave it there. That's fine. Cheers, guys. Have a lovely weekend. Pass you over to Sir.
Yeah, cheers, Alex. Yeah, so I guess in summary here, there's opportunities out there, but you've got to control that risk. You've got to be patient and absolutely wait for your edge. Don't get married to necessarily a bias that's going to be there. Um, any questions, as usual, guys, please do let us know. Be interested to hear what everyone's got to say in the chat. Do we think this is going to continue for a 7th, 8th day as well? Is there going to be some sort of decision made over the weekend that even goes as far as preventing short selling in the markets? Time will tell, of course, but I'll be interested to see what you guys think. Hope you all have a good trading session, even better a weekend as well, and I look forward to catching up with you all next week as well.
More from Anthony


Inside the Biggest Banking Stories You Need to Know This Week (Anthropic, Diageo, Private Credit)


Inside the Biggest M&A Deals You Need to Know This Week (UniCredit, GameStop, eBay, Eli Lilly)







AI Breakthrough or Hype? Anthropic’s Claude Mythos, Tim Cook Steps Down & LIV Golf Collapse