Stocks fall in October but what next?
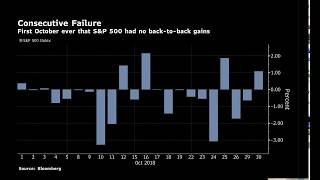
October 2018 saw the S&P 500 drop 10% with five 1-percent intraday swings and almost no consecutive daily gains. Weaker Chinese manufacturing and yuan pressure add to macro risks ahead of the US-China trade showdown at the G20 summit. Facebook missed earnings badly, while oil inventories are building.
Chapters
Good morning, Wednesday 31st of October. Happy Halloween. Just before I get into the briefing, quick word. Tomorrow night, so Thursday night at 5:30 PM, I'm going to be doing a live session on YouTube. It does have the ability to ask me questions in real time as well, but tomorrow night planned because we can review the Bank of England what exactly happens in the quarterly inflation report. We can do a preview for Apple's earnings, which are due on Thursday night. We can also do a run-up to non-farm payrolls and discuss just general broader markets as well. So feel free to join us if you're watching this on YouTube. That's going to be live tomorrow, tomorrow Thursday at 5:30 PM. Going to the briefing then, and let's have a bit of a review about the current state of play Yesterday was a particularly awkward session to trade, and I think really epitomizes investor mentality at the moment, which is a little bit caught between where do we go from here. And with that being said, let's have a bit of a review of October as a whole. This is kind of a sequence of charts I think we should, uh, we should discuss that will probably then make a bit more sense of why investors are kind of fretting at the moment. Despite some of the economic strength of a series of data coming out the US. We saw that, if you remember yesterday, consumer confidence almost at a 20-year high, as mentioned by the— or measured by the Conference Board. But look at the chart that we've got in front of us here at the moment. This is the S&P over the course of the month of October, and obviously this is the, the kind of correction amount that we saw at the low at that 10% level. We have since bounced, and interestingly, we've managed to get above— our heads above this trend line that's been in play the last 2 weeks. We'll have a look at the broader picture in a second, but obviously we've had quite severe bouts of selling pressure, not to the same ferociousness of February's kind of synchronized tightening fears that saw— was kind of sparked by I remember payrolls at the time, and then the market dumped on the Monday because of the fear of policy tightening. The thing that's been telling here with the October sell-off has been this, and this is— we've had taking from the market close yesterday, 30 days into the month, and there's been no back-to-back gains for the S&P 500. That is, in fact, for October, the first time that that's ever happened. The index has only closed higher for 6 days this month. So you can see here, you know, going back on the 10th, the 24th was when we saw the most severe selling pressure. Obviously some of the latest catalysts, certainly in the last 2 weeks or so, have been earnings-inspired. Some of those industrial names, you remember, that'll probably explain the, the dip that we had on the 24th, just kind of paying heed to the fact that, you know, price pressures are squeezing margins for a lot of those industrial names, and they're having to reevaluate their kind of profit outlook. And this also comes in the context then of trade wars predominantly, which has weighed on that, that kind of sentiment. And then also things like corporate tax cuts, which kind of elevated profitability of the last quarter. You know, this isn't something we're going to see dramatic corporate tax cuts every single quarter. So that's chart number 1, or as Piers would say, exhibit number 1. I know he likes to go down that route. Exhibit number 2 is— this was yesterday's session, and you know, monitoring the chat in Trading Live, there was quite a few, um, good discussions lightly heated, which is the way we like them, because that means they're opinionated. And what there was— and I think this is a reflection of the market volatility— what was really interesting, even with an incredibly small sample size in Trading Live chat, about 50 people, there was quite diverse views about where do we go next. People talking about the recovery, the buy the dip. There's people talking about no, it's the opposite situation. And I think that even small number of people is a reflection of kind of the broader environment at the moment. And if you look here, we've got a snapshot of the intraday volatility. So yesterday the S&P 500 saw 5 swings of at least 1 percentage point either up or down. You know, this is— if you go back to the end of Q3, Q4 of 2017. I'm trying to think how many days it was. We went a long period, months, without seeing even a 1% move in the market. I think the average S&P percentage change over 2017 was something like less than 0.2%, and yesterday we saw 5 swings of 1%. And this wasn't really anything triggering a catalyst. There wasn't kind of any breaking big news that was causing this. I i.e., 5 individual unique headlines. This is just the indecision in the market. And so I think one of the things— and again, some of the guys were chatting about this yesterday— is about just kind of trading what you see. And although there is obviously a necessity to try and have a fundamental bias, in occasions like yesterday, sometimes it's either really two approaches. One, as I said, trade what you see and just go with the flow and the trends that are materializing. Or two, just stay out of the action, maybe focus on a different asset outside of the equity space that might be showing a little bit more cleaner trend. And certainly for one, oil on the break of that kind of rising trend line was quite a nice trade yesterday that I know some of you got hold of. So kind of picking your battles in that sense. It's not always a case that you have to sit here and, and although we go through the due diligence of trying to work things out and obtain this bias of direction. Sometimes, um, there isn't the ability to do that, so you've just got to let the market kind of show its hand. In terms of timing, as per usual, it typically is the US session when that tends to materialize. Other things, um, this is, you know, not something I'd look at day to day, but Bloomberg are kind of highlighting it from a statistical point of view. I guess it's quite interesting. This is the tick index, which measures the number of stocks going up trade by trade versus those going down on the New York Stock Exchange. And what we're looking at here are the kind of extremities of price swings that we've had over the last 2 days. So the breadth gauge spiked almost 1,500 before tumbling to -1,700. So you can see that here to here on these points, such a big intraday turnaround has happened only once before in data, i.e., here in 2010, i.e., the midst of the financial crisis. You'd have to go back otherwise to 1989, the last time. So we've got the flash crash, 2010, and then going back to 1989, the last time we've seen these kind of big swings from one positive to negative move in a single, single day. Exhibit 4 is then looking at— I may have jumped the gun here, there was one in between, but let's go with this one anyhow. Anyhow, uh, this is utilities. So obviously a lot of, uh, questions yesterday as well is, well, you know, where is the money going? Oil's been moving lower, um, equities moving lower, all these emerging market currencies are weakening. Well, you know, from a broader context, gold's had a bit of a, bit of a fight back of recent times. We've had one of the best months there in, in some time. The dollar continues to, to pick up some pace more broadly, but looking on a single sector rotation, if you like, this is quite classic defensive plays. And what we've had is power companies have had their best month relative to the market since 2001. And such returns in terms of the rally that we've had of more than 3% in October for the utilities, that move, uh, beating the S&P 500 by 12 percentage points. So such returns have occurred only 4 times previously, and on those 4 times was all surrounding market crashes. So again, quite interesting statistic to see the way of which, I guess, investors are looking to, you know, rebalance in that sense to more defensives. Looking elsewhere, Exhibit 5 is looking at more the growth stocks and the Russell 1000 growth stocks. So kind of a more broader assessment of some of the, the lower cap And domestic names have plunged below the 200 DMA relative to value peers for the first time in 20 months. So growth-oriented areas of the market such as technology sector have obviously been ones which have outperformed the market quite substantially over the course of, well, really Trump administration commencing, and so subject to quite wicked pullbacks under the guise of kind of the trade wars and rising interest rate threats and so on globally. And then finally, the tech stock or sector in itself, you know, if we're looking at the VIX, the volatility index, uh, so this is looking at the options in the market as a gauge to impending kind of fears of market movement and volatility. The spread between basically the NASDAQ volatility index and the CBOE VOL index, which is the S&P is close to its highest level of the year. And that's again, it kind of carries through the same with that last graphic. These technology names have been the most subject to selling pressure. If you note that whenever you kind of look at the US market close, it tends to be the NASDAQ that either out- or underperforms. At this point, underperforming has been the most, the most common kind of theme. So Not to sound too bearish from the various graphics that I've showed you, but kind of just putting together a lot of the weakness that we've seen. And, and certainly for all the things I've just mentioned, you know, a lot of these are statistically very relevant in terms of it's not really occurred in this type of persistent selling pressure in a long period of time. Time. Here's the overall summary. And so hence this buy the dip mentality. The question is, is that going to happen this time, or is it now sell the dip? And this is just having a look at the S&P 500 here on a slightly longer time frame. Let me just squeeze the chart slightly, or let me just move my video so you can see it a little clearer. So All we've got here is the performance of the S&P over the period of the year. You've got the February sell-off, which in itself I think was still slightly larger than the one of which we've, we've seen materialize this far, but only just slightly. The point here is this trend line from the retest that we saw in April. We have traded below here briefly, only in the last few days. However, at that point, you know, this is when we get that buy the dip mentality. I mean, if you look at the S&P, I think we were talking about this, I think I mentioned to Will in the Trading Live chat room, I was kind of saying that, you know, if I had a bigger pair of conkers in my pocket, then I would have probably have thought it's got to be buy the dip at these types of areas. And you know, the conversation was, well, actually this $2,700 is what looks quite interesting because here you can see we've got an opposing trend line going from the actual what was the previous all-time high before the February collapse, the recovery then in June, the bounce that we had in October. And you can see how this quite nicely has played out over the last couple of sessions here. We're right on there testing it now. The question mark being then, could this be— if you're of that mentality— a point if we get a breach, then using this kind of area to then play the market back up again? But again, as I've been saying, the indecision is there. And I don't know, as I just said, it would take a pretty brave person, I think, to— would have caught that that move, albeit it was a strong one. I mean, we recovered quite sharply over the course of yesterday's session. Obviously, we've had a lot of commitments from China still to prop up their market, which mitigates one of the big clouds of uncertainty, uh, in the wake of the trade war situation. That is the kind of slowdown that's materializing in China. Of course, on that front, let's talk China. So this is what we're looking at. We had some data overnight, which was the, the manufacturing PMI, and this is obviously one of the tier 1 pieces of information that we see. This isn't the manufacturing data I'm showing you, this is GDP, but I wanted to put it in a little bit of context because the manufacturing PMI last night came in at 50.2. That was below expectations. The gauge for new exports, or new orders for exports, which gives an indication of demand, fell further into contraction territory. In fact, it was the lowest leading or reading since early 2016. So certainly this does start to bring about some quite troubling questions, because if exports at the moment are decreasing and they're in contractionary territory for the lowest point for 2 years, Don't forget, China has had the benefit of exports being largely propped up by the front-loading, looking to get ahead of these tariffs which have been getting increasingly higher from the US. And so if you extrapolate out that factor, then you could say, well, Q1 could be quite problematic coming up for China, and problematic coming at a point where it feels almost like China's coming towards a bit of a cliff-edge scenario where the currency is at a real pressure point at 7 against the dollar, which is a, a level of which China have kind of been fairly vocal that they'll look to protect. The point being here is that a weak currency can be beneficial obviously for a largely export nation, but if it breaks a psychological level like that The probability is, is that you'll get a bit of a run on the currency or weaken further. Central banks don't want to be in a situation of stepping in using vast amounts of foreign reserves to counteract and prop up a currency. And then secondly, what if then you have mass capital outflows out of that country? The whole thing can escalate very rapidly, which would be highly detrimental to China. But not only China. The global economy. Hence the reason why the market's a little bit nervous at the moment. And trade war sits, and, uh, and Mr. Trump right at the center of this. Um, at the moment though, we've obviously, as I mentioned yesterday, you saw the regulatory bodies in China looking to, uh, to step in and help in various ways. Uh, you've had government support and central bank in the form of boosting liquidity in the system, tax deductions for household targeted measures aimed at helping exporters. So, you know, certainly as long as China can contain that and the fallout and the slowness in growth doesn't get worse, then I think this is quite critical on whether or not in this S&P question for the broader market, whether we will push lower or rebound in that sense. So this brings us to the GDP chart we're looking at, because don't forget where GDP is trading at the moment in China, year on year 6.5%. If we look at here on a 5-year, you can see why the market is so sensitive to the slowdown that is happening in China, because we haven't really been down this low ever since the financial crisis when we were just above the 6% level. Hence the kind of nervousness in the market in broader Asia at the moment. Japanese and Korean industrial output in September also lower than expected. Um, there are some unique cases here that would explain that. Uh, natural disasters in Japan cutting production, autumn holidays, um, in Korea reducing actually the number of days that factories were open. So I think you can't read quite so clearly into it. There's been some isolated one-off reasons to explain their weakness, but overall Asia-Pac has been slowing. Whenever you get Chinese manufacturing data, you also simultaneously get the release of non-manufacturing, which reflects basically the service and construction sectors. That also was weaker than expected overnight. The service sector component dropped 1.3 points, and that's the lowest level since mid-2016. So, you know, this isn't just manufacturing, this is more broad in that sense. Now, what is, I think, going to be quite telling for me, could be pivotal for whether or not the lower bound of this S&P is broken, is, as I said, trade wars is one of the big issues here. I think that the markets— I'm going to put it out there— I think the market's going to hold those previous lows, and I think that trend line in the S&P for the year is going to hold for the moment. I think Actually, the key whether or not that breaks is going to come at the G20 summit. If you think about what's happened in the last couple of days, Donald Trump, as I said yesterday, has kind of put the loaded weapon on the table and said, China, we are going to do more if you do not play ball and make the relevant concessions by coming up to the G20. Now, a lot of this obviously is driven by the political narrative that Trump has the midterms to manage, which are coming actually next week. But also, secondly to this, he wants to push the envelope ahead of the G20 summit, which is happening at the end of November. I think that's quite critical for broader market sentiment, is where is this China-US trade situation at, at that point, and what is going to be the conclusion of markets. At that particular juncture. That I think could be quite defining for how we see out then the rest of the year in the equity space. Can Trump, by being Trump, extract the necessary concessions? On that note, I had to share this. I just thought it was too good not to show you. I did tweet yesterday after US consumer confidence was phenomenally strong. Lo and behold, I think 24 minutes later, Trump comes out tweeting, US consumer confidence the best since the year 2000, so on and so forth. Well, actually, technically speaking, he's not quite true, but since when has Trump been exactly true to the detail? Very rare. But the— this is just a graphic of his tweets And the one that was brilliant yesterday was that, as you can see here, as the market, the stock market, through his reign as the president has gone up, he's been very quick to talk about winning streak, record. When we've hit record highs, he's often tweeted, like he did here 5 times in one day, about we've hit a record, a new record. We get the uppercase Make America Great Again. He really got excited in the Christmas period. But, you know, this is— you know, Trump's not silly in the way— if one thing that Trump is very good at, it's manipulating the media. I don't think you can deny him that in a sense of, you know, him tweeting this type of thing bang over the Christmas period, you know, is all part of his whole management of his persona. In that sense. The funny thing was yesterday, obviously the stock market, for all the negative reasons, is right on the precipice of something of, you know, do we go lower? This is absolutely troubling for him at the point of a major political event coming up next week. And what did he say? Well, he said this is because there's a threat of the Democrats coming into the House. This is just a pause and you can blame the other political parties because I've made equities go to record levels. So anyway, just quite an interesting graphic of, of Donald Trump's communication. Other news, let's just quickly wrap it up. Japan, not going to spend more time than necessary to talk about this. Japanese monetary policy is relatively dull in comparison to, say, the US and ECB elsewhere. But Japan's central bank standing pat. Risks rise in the longer term to stoke inflation. They trim their inflation forecast through early 2021. Elsewhere, oil, oil markets, we had the data yesterday. So let's just bring up the chart, let's have a quick look. Uh, this was the, the kind of breach that we saw yesterday, uh, that came and we kind of broke lower, got down to the relative S2 on the day Um, was quite a nice also recovery after we breached, got to the S2, we came all the way back up. So just kind of up to that area on the recovery, then came back down to the previous low of the 23rd, so from last week. Then the market moved back up. So you can see how, you know, when the market is seeing a bit of a lack of commitment in either direction, the technicals, uh, can start to have a much greater influence on markets. Behavior, because then, you know, everyone else is looking from a speculative point of view at the same level. So again, you had the breach, the move down, break, break of that level. You can see that when we tripped the 6575 stops run, because that would have been a logical target, we initially spiked down to S2, come back up to the trend line, back down to the previous low, back to the trend line. You know, it's worked out quite nicely. I know for someone like Sam, for instance, you know, this is kind of bread and butter for the way that he kind of approaches the market in that way. Looking at the, the candlesticks, let's have a look at half past 8, uh, so slightly earlier of course due to the, the clock change not coming to the US. But that candlestick there is the oil inventory numbers, so not too much of a movement. Just to recap what the numbers were from the APIs last night, You had a crude build actually, so this is a bearish outcome of 5.69 million. This was since expectations of 3.2. This is actually the 6th weekly rise in inventory, so maybe just the fact, you know, markets have moved higher. Don't forget, Cushing was bullish because the build was smaller and gasoline was quite a large draw, so there's a little bit of a bearish tilt to this other than the headline. And maybe the headline is not so much of a surprise because seasonally this does tend to be a period of the year when we do see headline builds, and this is the 6-weekly rise. So maybe that's largely expected, and some of these other numbers have caught a bit more of the attention in that respect, and hence we've moved a little higher. We'll look at these again when we get into the crux of the, the DOE numbers this afternoon. Earnings-wise, there's been a couple of things. I won't go into everything. There's been a few Euro Stoxx-related companies Um, also Spanish, Santander, Repsol, some of the larger French names. So for the pharma sector, Sanofi earnings grow, um, the drugmaker's forecast actually edges higher. It's the first increase in quarterly earnings in more than a year, and they modestly boosted their outlook. So amid all the kind of negativity in a lot of the earnings that we've had, they're coming out quite positive. Airbus profit climbs, higher delivery, deliveries, mask production woes. Kind of headline for them. And then of course we had Facebook last night, and actually, you know, tech— the market's very tech sensitive, and I actually think Facebook, um, helping some of this rebound that we've had in the equity futures this morning. The S&P, you can see, um, as we start to edge higher here in the S&P, you've got that R1 coinciding with the high from 2 days ago on Monday. So, and that also close proximity to low printed back on the 11th. So quite an interesting area of resistance, but equity futures on the front footing. Facebook initially fell last night about 5%. The revenues was a miss, daily and monthly, uh, monthly active users were a miss of expectations. Their headcount had gone up 45%, which means their costs have risen 53%. So remember what we were talking about in the preview for Facebook, um, due to the kind of regulatory, uh, requirements, if you like, for them to be responsible about their content moderation. They employing an extra additional 20,000 staff, which is a monumental increase for someone like Facebook. Tech stocks generally a much lower degree of workforce for the output of which they're valued. And so that's meant that their costs have gone up, um, over 50%. Shares fell 5%, but then they rallied and actually moved higher quite quickly. Don't forget, the whole reason their shares fell some circa 25% last quarter was because they already said that this type of thing was going to happen. So you had an initial kind of shock reaction. This wasn't particularly upbeat. If anything, it's still negative. However, it's in fitting with what they've already telegraphed. So actually, it's bad, but it's not as bad as it could be because they've already kind of set a pretty low bar for themselves. And so I think, you know, these tech earnings— you've had Facebook, there's one remaining FANG to report, and that's Apple on Thursday. But I think Facebook was actually marginally positive in some respects. So again, protecting some of the near-term downside levels for these US indices, irrespective of some of the slowdown which we've talked about in China. All right, wrapping up, let's have a look at the calendar for the week ahead— or excuse me, the day ahead. And probably the highlight of this morning that we're looking out for is the CPI flash reading coming out of Europe. This is obviously pivotal for the main components of what ECB policymakers are looking at, and so the euro, European assets could be quite sensitive to that release. Expectations on the year-on-year, 2.2%, so a slight uptick. I do want to mention though that really it's the core readings that I think are much more telling. If you look at actual inflation here in the euro area at 2.1%, you could argue, well, it's been relatively comfortable around the ECB's target. But if you look at the core reading, it tells a completely different story because core CPI has been tracking about half of that. And that owing to the fact that over this recent period, don't forget, inflation has been chiefly buoyed by the fact that energy prices— if we go further back, exiting out the last 3 or 4 weeks oil had been rallying to the upside. If you strip oil and some of those volatile components out, inflation— not underlying inflation— not so compelling. And so I still think that these numbers do carry some credence for, for ECB policymaking. So keep an eye out for that 10 o'clock and the core number in particular. Then moving on, the precursor for non-farm payrolls, we get ADP national employment. That'll be at 12 15. That's expected at 189, uh, range of 155 to 260. So quite broad range here, so keep an eye out for that. And as ever, be mindful of the revision to the previous, which can often mitigate the price initial reaction to the headline. Uh, anyone trading the CAD, the loonie, you've got CAD GDP producer prices. And then this afternoon, remember, an hour earlier than normal, you got the DOE oil inventory numbers at 2:30. And we'll be looking at that in more detail again ahead of the release. Speakers-wise, um, a couple of ECB guys coming up, Novotny and Visco, this morning. But other than that, relatively quiet, not unless you're staying around late evening. You've got the BoC Governor Poloz and Deputy Wilkins speaking. All right, that's it. Let you guys crack on. Sam's already shared some charts in the Trading Live room of some other setups that he's looking at in the FTSE, and I think dollar CAD. So do check those out as well when you get a second. Otherwise, thanks very much, have a good day, and I'll chat to you later.
More from Anthony


Inside the Biggest Banking Stories You Need to Know This Week (Anthropic, Diageo, Private Credit)


Inside the Biggest M&A Deals You Need to Know This Week (UniCredit, GameStop, eBay, Eli Lilly)







AI Breakthrough or Hype? Anthropic’s Claude Mythos, Tim Cook Steps Down & LIV Golf Collapse