US Non-Farm Payrolls LIVE
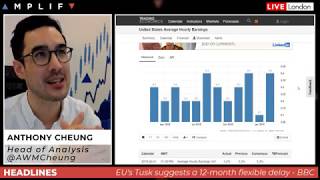
Anthony Cheung reviews pre-release charts and employment data before the U.S. Non-Farm Payrolls report, with consensus expecting 170k jobs added. NFP came in at 196k while average hourly earnings fell to 0.1% versus 0.3% forecast, prompting Piers Curran to outline trades: short GBP/USD, long Treasuries, and long equities on solid job growth without wage pressure.
Chapters
Okay, just testing out the mic. Hello and thank you for joining us. Let me get my feed up and running. Just going to make sure everyone can hear me. If you can hear me, there's a chat function on the side of the box of this broadcast. So if you look on the other side of the screen, there should be a chat feature. Feel free to drop us a why in there if you can see us talking at the moment. What I'll do is I'll give us about 5 minutes. I'll let the— I'll let everyone get logged in. Feel free to ask any questions as we go through. So Philip, thanks for joining us. Andrew, Charlie. So Charlie, Sam are here. They're in the chat room and they're more than willing to help as we go through this entire event. So feel free at any point as we're going through from now forward to ask them any questions that you have. What I'm going to do is I'm going to wait for for until 5 minutes past, so another 2 minutes, and then I'll commence a short rundown for Nonfarm Payrolls, which is coming out in 27 minutes. And then what's going to happen is we're gonna broadcast that and analyze it live. Uh, you're actually going to have Piers Curran, our head of trading, is going to replace me while I just work with some of the other traders to analyze this event. So he's going to sit here and he's going to guide you through, but I'm going to give you a bit of a short preview. And as I said, I'll start that preview in approximately 1 minute's time. Thank you for joining us. Yeah, let's hope non-farm payrolls, Charlie, doesn't let you down. Almost a certainty to provide a degree of volatility, as normally the case. My mic is going to be running throughout, so I'll be able to broadcast a squawk via this platform. Before we begin, anyone new to joining us, you should be able to see now coming up momentarily on my screen, that's my Twitter handle if you'd like to follow me. @awmchung. The Amplify handle is @askamplify, and we tweet interesting articles related to financial markets throughout the day you might find quite useful. Okay, so let's just get straight into a preview then, and there's a few things we can discuss about how to tackle an event like non-farm payrolls. So first off, let's just start with what's been happening so far today and just a quick review of the charts and what I've got here. You've got EURUSD top left, you've got cable in the center, you've got gold on the top right, DAX center left, NASDAQ futures— these are all charts for futures markets— in the middle, S&P on the right, WTI crude futures in the bottom. And a US 10-year T-note future in the bottom right, just so we all know what we're looking at. So pound has been relatively busy, of course, lots of news coming out in regard to will they or won't they, as in Theresa May and Jeremy Corbyn, be able to strike a deal that will satisfy both individual parties. The latest I can see here from about an hour ago or two was that Brexit talks between May and Labour leader Corbyn are not going well. So hence the reason why— really, let me, let me just explain this cable chart. We rose. This is when Theresa May opened up the idea of a shared customs discussion with Corbyn, and this leading the door to potential soft Brexit. This was the acceleration on that night, fairly illiquid conditions for the pound, of course, trading around 6 PM. Hence the quite extreme reaction. Europe come in, step into the market then, and this is quite traditional because most Major FX desks, if you like, are gone home by that point, gone 6 PM, and it's typically in North American trading hours then you get this secondary phase bid as soon as UK and Europe step into the market on the following morning. Then of course you've had the kind of realization, and as we were discussing in the market briefing this morning, that the actuality of getting a deal over the line is maybe not so straightforward as you might initially have thought. But then we rally again because EU's Tusk had that comment that was released by the BBC News early hours of this morning talking about a flexible 12-month extension. That is, I would say, a soft concession on behalf of Europe to try and facilitate a deal going through because they did say the UK could leave earlier if they could ratify a deal on their side. So the pound rallied. However, as a latest one I've just discussed, it seems as though negotiations between May and Corbyn aren't moving in the right direction. And so technically just finding a bit of a floor back down around the price action at the low that was seen yesterday evening. From here, although we continue to monitor any Brexit updates, really this is about a dollar movement now. Of course, with the currency pairs, you know, for anyone kind of newer to markets, the very important thing you need to remember here is that you're trading when a currency pair two currencies' fundamentals in that extent. So actually the pound is a little bit, uh, I guess can be complicated. You would say then the latest sentiment for the pound is slightly negative given we haven't made any further developments at this point between the two parties on this customs union shared ideal. If we were to get a very positive payroll report, what you might see then is that gives a trigger effect to break that low yesterday's low in cable and the 131 handle. And you might then be looking for that extension for the push lower in the currency pair, because if you think about it from a fundamentals point of view, you've got a weaker sterling narrative with a positive dollar story. And that's the perfect kind of storm to give a nice directional clean bias to a market, of which then if technically breaks these levels, probably be targeting down to that S1 level in the futures, this would be down at those levels that were seen, uh, going back to what, the 2nd? So right at the beginning of the week, really. But again, that's on the basis that we get a good payroll report. So let's get on with that. Let's talk about payrolls. Now, the payrolls usually comes out first Friday of the month, um, and what we see ahead of non-farm payrolls is a usual selection of employment data that comes out of the US that acts then as a reference point for what we can try to ascertain the health of the overall Bureau of Labor Statistics employment report would show. And by this, what I mean is there's lots of different economic indicators in the preceding few days of which have an employment kind of skew. Now Let me run you through what we've had this week, starting with probably the most typically seen as the most influential precursor of non-farm payrolls. And this came out on Wednesday. This is something called ADP employment change. This is private payrolls. It's a very large data set. It's not an exact mathematical science, but tends to be correlated in a sense that if ADP underperforms then on a longer-term average, NFP tends to point directionally the same way. In this case, what's been interesting is that ADP was a fairly large miss on expectations earlier in the week. ADP came in at 129,000, expectations were for 170,000, so it was actually a downside surprise. Now, what does that look like? Well, here is the— let me me refresh this so we can see it on a bar chart. So ADP, you can see here, was in fact 129,000. That's the lowest that we've had in the last 12 months. So if you think about it, ADP last month had quite a big breakdown with being a good correlated indicator of non-farms, because last month, remember, ADP came in at 197,000, and the headline change in non-farm payrolls was of course 20,000. Huge disconnect between the two figures. What's quite interesting this time is, is that ADP has gone even lower, 129. So what does that mean for, for non-farm? Well, this is just one consideration. Um, at 129, that's the smallest payroll increase since September of 2017 for private payrolls. But this is just one consideration, as I say. Other things then that we need to take into consideration here are the ISM manufacturing numbers. Now there's two of which you have, manufacturing and non-manufacturing. Now a couple things, ISM Manufacturing came in stronger than expected. Faster increases were seen in new orders, production, and importantly the employment constituent. In fact, I've got some data here for you. The ISM's employment subcomponent increased by 5.2% when compared to the February reading of 52.3. So that is a positive precursor for non-farm, for the manufacturing sector of the United States. But of course, the economy is made up of more of just manufacturing, so we have to take into consideration the non-manufacturing part of the economy. Now, that came in, as you can see here, just printing a very small number on the bar chart, just above 56. So 56 was below market expectations of 58. It was in fact the weakest expansion in the service sector in the US since 2017. Uh, the subcomponent for employment though did increase very marginally, nowhere near as strong as manufacturing. But even though the headline composite non-manufacturing number was down, the employment subcomponent was up 0.7%. So the ISMs are indicating potentially a positive employment situation. Remember, all of this data is for the month of March, which is the same survey period that we're looking out for, for nonfarm payrolls coming up shortly. So that's 3 things. The next one is something other people will also look at, and I would say this is a lower weighted, um, I'd say, data input for my overall perception of what I think the jobs report would be or what it could come out as. But it does add more interesting evidence. This is job cuts. It's a data piece called Challenger Job Cuts, basically chopping up the US economy into different subsectors to tell you the number of job cuts in each unique area. And what we have here is that US jobs cuts announced by the US employers fell over 20%. So actually unemployment has dropped by this measure fairly sharply by that measure. But let's just put that in, in context, because 20% as a percentage sounds like a big number. But one thing I'd always say, say from a statistician's point of view, you should never believe one number in isolation. That's rule 101. Because you actually look at the chart, this does tend to see fluctuations of a similar type of percentage magnitude. So although 20% sounds large, it's not actually huge by that respect, but nonetheless it's dropped, it's decreased, which again is a positive sign for employment conditions. Next thing is jobless claims, people claiming, or Americans filing for unemployment benefits. And as you can see here, and as you, if you're a more experienced trader, you will know This is data that comes out every Thursday. This is a weekly economic data point, unlike the others which are monthly, which we've just discussed. Now here, what I can say is you look at the 4-week average for the month of March, and if you look at that, the rate of initial jobless claims has gone persistently lower. So this would be another positive sign, uh, on the fact that people are claiming fewer benefits. This then leads us into how does this shape our expectations for the headline change in non-farm payrolls. Now obviously last month when we had payrolls, it was a shocker, came in at 20,000. It smashed through even the worst, most pessimistic, um, estimate on the street by a country mile. It was expected at 180, came out at 20,000. Now reading most bank economist research notes this morning, most of those banks are looking for a bounce back to a median expectation of around 177, 177, 180. So we're looking for a bounce back, back into this region here, which would pretty much, pretty much put us back at the 12-month average. Now, the reason that they're saying— and this is what I'm getting from most the people I'm talking to— is the reason for the depression in the prior month in February for a number of jobs created was down to the weather conditions experienced in the United States. And so one thing I think you need to be careful of this time round as well is any revision to the 20,000. What does that look like? Well, here's the median expectation and this, this kind of orange bar is the median. So you can see here visually this pop back that we've had. Remember, weather has been explainable in previous occasions, if I remember correctly. September of 2017 was Hurricane Harvey, I believe, and that was when we had that really catastrophic drop, only then to punch above 250 the very next month. So when it is weather-impeded, obviously that is a one-time event, and if all things remain equal, the data tends to revert back to its mean, uh, in that sense. The other numbers, of course, we're looking out for, and this will continue to be of great influence for the overall outcome is average hourly earnings, wages, for example. Now here, if I refresh this and put it onto a bar chart so you can make a bit more sense of it, this is what caused quite volatile reactions last month. Remember, data releases on the immediate release are very high risk for a human trader. What I mean by that is The initial second release, I would say, is not worth even contemplating trading because you are unable to trade fast enough. Fast enough, by that I mean to compete with computers, programmed machines which are plugged in literally to the statistics office, which will be reacting to this in a, you know, microsecond. That's then dependent on the first inputs of which the first number is non-farm payrolls, and you get that first knee-jerk reaction, whether it be up or down. And last month was an exact case in point. You had an initial reaction to the headline, but then actually, despite low job creation, wages were up higher than expected. And so you reverse that move very quickly. That's why to trade these type of events— and we're quite lucky we've got Piers Curran, the head of trading, is going to jump on and guide you through it. Can't think of anyone better, more experienced, to take the helm for this event. And the point being is that it's what happens thereafter and what is the overall perception of the data as a whole for then the prevailing trend in the market, and then using your technical points you've already identified ahead of time to execute that trade should it materialize. So this is all about discipline with these types of events to be successful in trading these high volatility kind of situations. Um, so the wage data will be key. To give you an idea of expectations here from the wage component, we're looking at a range— expectations are for a pullback to 0.3%, which I think is not shocking in any means, but we have a wide range of 0 to 0.5%. The one thing I would say about the wage number is I think a little bit of the sting out of that number has been taken out comparative to other recent months. Because the Fed have turned so dovish now, I think the bar has substantially increased, and this wage number would need to be 0.6% for the markets to be spooked about policy tightening now. I think the Fed have set out their stall And so in that respect, I wouldn't be looking for a sustained move. If we hit 0.5% and it's a reasonable headline jobs number, I would expect the initial interpretation to be a classified hawkish one— dollar strength, US yields moving up, Treasuries down, gold lower— in that response. A few other things to mention, then I'll hand you over to Piers. What are the primary dealers thinking, because this is where it's at, you know, internally at Amplify. Even though we know the market consensus is for a 177, 180, we have an Amplify internal guess. Um, to give you an idea, the most bullish bank on the street is Royal Bank of Canada, and they're going for 225. SocGen 200, Jefferies 195, Goldman 190. The dealer median is 170. The most pessimistic on the street is UBS at 146. So take your pick out of those. Uh, the final thing to be aware of then is the unemployment rate. I really do think this is of lower significance to the wage component, I think, as well. Not only with the headline jobs, you need to be very mindful of revisions to last month. I think could be quite pivotal. The final thing is then unemployment, as expected, at 3.8%, is respected to— expected to remain unchanged. 3.7 to 4% is your range there. And that's it. Let me hand you over then to Piers. If he wants to jump on, talk about some of the charts, uh, and maybe what assets that he would favor to trade in this type of situation. I'll get him to comment. Otherwise, as I said, Sam is available in the chat room, Charlie is there, Tommaso, some of the other Amplified Traders are in that room. Feel absolutely free to ask questions, uh, happy to answer them. All right, I'll hand you over to Piers. Good luck if you're trading it. And I'll catch up with you at a later point. Take care. Piers, over to you.
Okay guys, so thanks, Ant. So let's just do a time check. So 7 minutes, 7 minutes 20 seconds. So let's spend this last kind of few minutes just having a look, around the charts. And, you know, when I'm looking to trade payrolls, it's normally— and just say something quite interesting there, which I agree with, which is that a bit of the sting has been taken out of the importance of that average hourly earnings number, that wage growth number, which really has been the one to be monitoring over the last 12 months. I would say the importance of that has taken out, and that's just because of the Federal Reserve. And, you know, let me show you that chart again. Well, let me show you the, the average hourly earnings chart that Ant was, uh, looking at. Let me just find it. Which one is it? There it is, this one. And so, of course, what we've been looking for is wage growth to tick higher, and then that leads to more inflation, which would, you know, ensure that the Fed carries on hiking rates. But of course, the Fed have now changed their message and they're not hiking anymore. But, you know, I still think this is of importance. And so even though this kind of whole day, this whole sort of data set in a way is called the non-farm payrolls, really, actually, I think the— if anything, the average hourly earnings is the most important. But because of the Fed's angle Trading equities off this can be quite tricky. This was certainly the case, you know, in the last few payrolls. I think trying to trade the S&P is difficult because, you know, on the one hand, if it's bad news, well, okay, bad news economically, stocks go down. But then if it's bad news, well, then isn't there more likelihood that the Fed might even start thinking about cutting rates in which case cutting of interest rates, well, that's good news for stocks. And so you kind of get that conflict. So trading equities can be tricky. You can get movement in both directions. Also, don't forget, like what happened last month, we had really bad payrolls figures but better than expected wage growth data. So that's the other really important thing to remember here. We get lots of information all at the same time, and quite often there's conflict. Some of the data is good, some of it's bad. Then it becomes tricky and you'll get noisy market reaction. You've got to very quickly make the judgment, well, if there is conflicting information, well, which piece of information is more important? And then, and, and, you know, that might come down to how far away from expectation is all of this stuff. So you've got to be pretty quick to interpret a large set of numbers, and that's why it can be tricky. For me, I'd be looking for the dollar, um, certainly dollar strength, um, any, any good news. Let's have a look at the cable chart here. Let me change up my screenshot, and we're going to have a look at the, some of the charts. So, um, good news, so that would be anything where the payrolls number, you know, has that rebound from last month's really bad figure, you know, anything above let's say $200,000 would be good. Remember, the average expectation is $180,000, so anything above $200,000 would be good. I mean, there's a chance it might be, it might be a number above $300,000, and obviously the higher we get, the, the more interesting. Quick flick back to the payrolls chart. Anything above $311,000 would be the best reading in more than 12 months. If I go back 5 years, yeah, we had a reading up in the kind of $330s. That was at the start of 2018. Okay, but, um, anything, anything that's above $311,000 is really strong, of course. And here you're going to get some dollar strength only if, of course, the wage growth data is also strong. I mean, that's the best case scenario— strong non-farm payrolls number, strong wage growth number, right? Then we've got something interesting. You'll get a cleaner move. And the dollar will strengthen. And so for the dollar against the pound, because we've had a lot of weakness in the pound in yesterday's session, okay, so if you get dollar strength versus a weak pound, you're probably going to get some decent action to the downside on cable here. So certainly looking for the test of that low point that we had back on the 2nd of April. If I just get my— and actually, let's go back a bit further here. I'm gonna go to a 2-hour. Timeframe. So there's two targets initially on the downside. It's that low from the 2nd of April, that's at 1.3063. Do understand that that was also what strengthens that level. It was the key low that we had back kind of, um, on the 21st of March as well. All right, so anything around 1.3060 area is important. Then it's the low, um, set on the 29th of March, which is down at 1.3026. And below that And I'd say anything above 300,000 with a strong wage growth number, you'd expect both those levels to break, and you'd be expecting a move down through the 130 handle with the low, um, with the low here on the 11th of March at 129.63 being the target, you know. And you can get down there, that's only 150 pips. So really strong data across the board can get the dollar to down to test the 130 handle and possibly through to test the March low. Okay, so dollar strength would be a good trade against cable. Against the euro, less so, and that's because generally— well, let me just go to a daily chart. Yeah, the euro-dollar is relatively low anyway, but certainly doesn't mean obviously you can't get the dollar strength moving lower. But the, the, the low point we had on the 2nd of April, 112.54, is perhaps that first key level on the downside. And then the big ones, the low of the year down at 111.83. Okay. But if you've got dollar strength, I'd expect more strength against the pound rather than the euro. More, more movement, better opportunity. I'm just going to speed up here. We're actually going to get the number in one 1 minute. So the other thing is to look at T-notes. I definitely think, you know, certainly bad data, long T-notes would be a good trade. And that's because generally we're down at the bottom end of what's been a very sustained downward trend. So I'd say bad news, long T-notes. Good news, I'd be looking to trade the dollar. Equities can be a bit choppy. Right, I'm going to stop talking and I'm going to let the mic do its job. We're going to get the data in 35 seconds. Okay, so remember, 180,000 expected for the non-farm payrolls figure, uh, the average hourly earnings figure we're expecting +0.3%. They're the two to be listening out for. Don't forget about revisions to previous months as well. 15 seconds.
10 seconds.
Okay.
196, that's 196, probably expected over 180. Earnings about the month at 0.1, below expected 0.3. Euro at 3.2, below expected 3.4. Average weekly hours 34.5, that's in line. Unemployment rate, that's 3.8% as expected. The headline, that's revised higher to 33. The participation rate, 63%, down from the prior 63.2. Canada, that's -7.2, so that's -7.2 below expected of +1.
I'm going to flick that off. Right guys, we've got some mixed data. So firstly, that's not great from a trading perspective in that the payrolls number slightly better than expected, only slightly, but the average hourly earnings number is worse. So let's just review this. I'm just going to show— well, let's look at the markets. Obviously, the dollar's— I mean, we've pinged both ways here. Euro-dollar is pretty much trading where it was before we started, having had a choppy movement in both directions. You've got conflicting data here. It's probably the worse average hourly earnings number that's slightly more significant. So if you like I'd say my initial reaction to this is net-net, this is a slightly bad report. So the payrolls number was 196,000. It's better than expected, but it's not, it's not more than 200,000. And, you know, we had such a bad reading last month that, you know, getting this back up to just 190,000 isn't particularly impressive. So that average hourly earnings number number at 0.1, I think, becomes the slightly more significant figure here. Let me show you on the chart. This was the nonfarm payrolls chart. I'm going to refresh it so we get the new bar for this month. 196, marginal uptick to the revision from 20 up to 33. But so this is okay. All right. Slightly better than expected. But it's that average hourly earnings figure if I refresh this chart, you'll see, uh, we get that drop to 0.1. Okay, that's not what we were hoping for. We were expecting it at +0.3. So you— I'd expect this dollar— the thing is, for the dollar to weaken, like, let's say cable, for example, well, well, Sterling's weak. So can the dollar— you got, you kind of got two weak currencies now. So is there scope for cable to move higher in the face of what is ongoing, of course, Brexit risk or not. So that's quite a tricky one, I would say. Just looking at the S&P, I mean, ironically, if anything, it's the S&P that's had the cleaner of the moves here. And what's happened is we've broken the double top. So we had a high back on the 3rd, which was the almost like the double top for today's session so far. It's also our R1 pivot. So So that's been broken. And we just zoom in on a 5-minute timeframe here. You can see that— well, let's go 1 minute because you can see the kind of explosive nature of these kind of initial reactions. And so we saw a spike here from 128.86 up to what was the high there? So it's 128.93. So not that big a move, but that's because the numbers are in conflict. So I'd say net-net. Slightly worse than expected overall, this despite the fact the payrolls number is a small beat. Okay, so maybe the dollar, maybe euro-dollar can drift back up to its high of the spike. I think for, for the S&P, it's almost like the best of both worlds. What I mean by that, firstly, the job creation numbers better than expected, good news from an economic standpoint. But secondly, the average hourly earnings data— let me show you my charts with the S&P here. Sorry, the average hourly earnings data is lower than expected. That means less inflationary pressures. That means the Fed are okay to stick with their, you know, now neutral strategy on rates. There's no inflationary pressures building that might mean the Fed have to start hiking rates again. So this isn't a hawkish report. So Therefore, for the S&P, that's positive. So you've seen that step higher. Expect some support here at R1. Um, okay, so let's have a look, let's have a look at T-notes, because as I was saying to you beforehand, uh, what would have been a good trade is long T-notes off bad news. But because we got conflicting data here, T-notes is struggling to get anything going on the upside. We did have that spike higher. We did make a new high for the session briefly above the pivot. If I zoom in on a 5-minute, then, um, you'll see that, that spike and almost, uh, full retracement here. Um, so for T-notes, yeah, I mean, obviously T-notes trying to move higher off— the problem is that the better than expected payrolls figure is that's negative for T-notes. But the worse than expected— well, hang on, if they're gonna cut— yeah, I mean, that, that lowball, um, average hourly earning, average hourly earnings numbers positive for T-notes. We'll see. I, I might expect T-notes to settle but maybe kind of drift back up towards the highs, let's say, over the next 15 to 30 minutes kind of idea. But look, I'd say generally the The problem with these payrolls reports is, you know, they're billed as such important information, which of course it is. This often leads to traders almost getting that feeling where they absolutely have to trade because it's such a big event that, you know, you get into that mindset where markets are definitely going to react and there's definitely trading opportunities I'm definitely going to take. Sometimes when you get conflicting data, it's difficult. Look at the NASDAQ here because we're just about to test the high point from yesterday's session, which is also today's R1. So NASDAQ looking to try and make further gains. So you might well expect the S&P— if the NASDAQ breaks that high, you probably expect the S&P to go and break its high as well. Okay, so this is stocks benefiting from the fact that we've got positive positive job creation figures without the inflationary impact of better than expected average hourly earnings. So NASDAQ just having a little tester on, on the upside. Above this you've got a level which you might want to target, which is that high point that we had here back on the 3rd of April, and that's up at 7616. This is the 7— this is the 7 600 handle here as well. So actually, this is an important resistance for the NASDAQ. Yesterday's high, R1, 7600, kind of round number, psychological level. Let's see if we get a break here or not. Okay, looks like we're just easing through. So you'd expect the S&P then to perhaps, um, test its high. We're almost there, and the S&P S&P to perhaps also now make a move to the upside. If we just look on the S&P for some targets. Yeah, because we're up through, of course, we're up through the 3rd of April high, which the NASDAQ is only now just breaking or trying to break. So for the S&P, this is kind of new territory. For the year. We are making new highs for the year here for the S&P. I mean, you've got to— you've literally got to go back to October last year to find the last time we were above these levels. So we kind of got a 7-month high here for the S&P, which makes it harder to kind of pick out levels of resistance on the upside that are close enough. You've obviously thinking 2,900, and we've got R2 before then. So R2 would be the first one to look for, and that's 2894. So yeah, overall here then, stocks, stocks positive. The dollar's really failed to kind of get anything going. The dollar weakness idea isn't really playing out. Eurodollars trading exactly where we were before the figure. Just looking on cable, just testing the back on the low point here. So as I was saying, you've got a weak pound in the mix to think about, and it'll be interesting. Maybe traders are going to decide that ultimately this payrolls data is fairly neutral. So it's kind of back to thinking, right, weak pound, and maybe we'll get this downward trend. And we're just testing the low right now on the 131 handle here. It may be traders are already kind of putting that payroll Cable's data set behind them and getting back to thinking more Brexit than anything US dollar related. So Cable just squeezing through the low here. Yeah, let's have a look at crude oil. So Sebastian, I'm just looking in the comments here then. So Sebastian talking about crude oil, crude oil loving it. Well, crude oil has just made a new high for the session and broken above the pivot level. I'm just seeing gold top corner of my screenshots just made a new low for the day. So gold's just edged new lows down. Are you getting a bit of an acceleration there on gold as we break out? Let me just go to the 5-minute chart to zoom in on this. So you're just getting that breakthrough what was the kind of double, triple bottom of the session at 1291. So that's gone. On the downside for gold is the low point. I mean, we've got quite a way to go to get down there, but 1285 is that low point for from yesterday's quite crazy day. So for gold here, I mean, why is gold moving lower? Well, on the one hand, you've got good payrolls data. So that's, you know, risk on, if you like. So gold's a safe haven asset. And so gold's just ticked a touch lower because of that. But also gold responds to inflation. And so if you've got a negative inflation number, which we have in that average hourly earnings data, negative for inflation, negative for gold. So gold's just edged through the low. Oil, on the other hand, is doing the exact opposite, and it's made new highs. And so for oil, um, you know, it's more about that payrolls data being positive. Uh, that's good news if you want to call that positive from an economic point of view, then that's potentially good news from a demand perspective. I mean, I wouldn't— I'd hardly ever trade oil off payrolls, to be quite honest. Um, often the way oil response can really be as much as anything to do with the dollar. And the dollar really hasn't moved. I know cable has made a new low, but euro-dollar has gone nowhere. So oil generally has been in a fairly tight range for the session. We've been trapped between yesterday's low at $61.89 and the pivot level at $62.27. That's really just defined the whole day until now where we're just trying to edge higher. But it's been such a tight range. Range. If we do sustain a movement higher, then yesterday's double top really is the place to be looking for, and that's up at 6277. But yeah, gold's interesting. Gold's definitely the market on the move here, more so than anything else, with cable sliding slowly through the lows as well. That NASDAQ never quite— we got break, and then it just never quite extended on that yet. If we zoom in on the 5-minute chart here, we'll see. I mean, I, yeah, perhaps expect and favor, um, the upside here for the NASDAQ. I know we've had a good strong solid test of that resistance, triple resistance, remember. First test it's held, but it's not as if we've had a It's not as if we've had a quick reversal off that. If we did dip, then anything like support at what was the high of the day down at 75.85 might be interesting for a long. Otherwise, just waiting for that break higher. Okay, yeah, euro's just, just ticked down through the low as well then. So we just made a new low for the day on the euro dollar. It's kind of following, getting, just getting dragged lower by cable, I would say. So that correlation between those two pairs perhaps being the main catalyst for this euro dollar move. So yeah, the dollar's been a real mess here. Firstly weakness, then what seems to be now a little bit of dollar strength. And that's going to help with gold moving lower, of course. So as the dollar strengthens happens. That's negative for gold, so that'll help gold. Look, gold's down onto that S1 level now at $1,288. Keep your eye on that. Oil's just trying to continue to edge to the upside. T-notes have also just ticked to a new low for the session. So actually, of all— yeah, everything, definitely gold's the— gold's the biggest mover of all here. I would say. Just be aware for T-notes. I've talked about this level. When was it? Earlier in the week. We've got a massive level here on T-notes. We're trading on it right now. And this, this level is the— it's the January high. And we had a big gap on the 20th of March where we gapped up through that key level. Then we pushed higher. Now we're back, and this is a massive technical on T-notes. Be aware, okay? 123.08, January top. What's that, Charlie?
Um, dollar yen.
Bay4fx, Bay Forex Trader, dollar yen. Let's take a look then. Let me just pull up my, my dollar yen chart here. One second. So technically we're just testing that high from overnight. So this was back around about 1 AM this morning. Dollar JPY at 111, um, 111.2, and R1 in there as well. So, I mean, so you've got a touch of— as you've seen cable break lower than the EUR/USD, um, you've also seen the yen— USD/JPY just tick up to, to make a new high, but we, we, we've just tested that resistance from earlier on. If you go to— let me just zoom back out a little bit on some longer time frames because, um, what happened this morning, which was important technically, was that we moved up through the high that we had, um, middle of March. So, um, just be aware of that. That's good support, um, right on the kind of 1.1110 area. And so just look for that as potential sort of classic classic long support there. But above the— if you go to a daily chart, then, you know, last time we were above these levels was, was back start of the first half of March. And so you got a big level up at 112, basically around the 112 handle, which was the start of March high. And then you can see back here a key level back on the 18th of Dec after the Fed drove this market lower, and that was key support back middle of November and then start of December. So what, you know, 112 handle is really critical. We're definitely not going to get anywhere near the 112 handle today. And indeed, you know, from a dollar perspective, as I've been saying, this data is not that interesting. So finding resistance at the overnight high here for dollar-yen and just pulling back in, but that 11:10 area might be some nice support to have a think about. So things have settling down, um, as payrolls events go. This isn't very interesting just because again we've had a real conflict where you've got some good Payrolls data, so the job creation side is positive without being anything amazing. So let's just kind of finish and start to wrap up here. Let's go back to that payrolls chart. 196, better than the 180 expected, but not by much. Tiny little revision higher to the, uh, the, the February reading. They moved that from 20 $33,000. So slight positive here from the payroll situation, but then the negative came in when looking at the average hourly earnings figure, which was expected at +0.3, and it's come in at +0.1. And as you can see, that matches the worst reading we've had for 12 months. We did have a negative print back at the end of 2017, but basically other than that. This is pretty much matching the worst figure, the worst reading we've had, um, you know, in the last few years. You can see that this is quite nicely range-bound in the main, and 0.1 is the bottom end of that range. Um, so disappointing here. So conflicting set of numbers, which makes the trading opportunities not particularly positive. Um, the dollar perhaps sums that up the most, where you've seen some dollar weakness and then some dollar strength. It's against the pound that you've seen the best, the better move, and that's because the pound is weak. So it's almost like, forget about the dollar and we'll just get back to bearish pound because of Brexit risk. That's kind of the theme here, and that's why the cables dropped to test S1, and cables moved more to the downside than you've seen, let's say, the EUR/USD move. And then USD/JPY has really moved either. Just testing that support I said on dollar-yen at 111.10. With the NASDAQ, what I'd like to see is a drift a little bit further lower. I'd like to see 7585 or 7586, and that might be a good place to look for a long, uh, to then see the market drift back up to R1 and test that high at the 7600 handle. For S&P, similar, but looking for the retracement to the 3rd of April high. So that's at 2889. So that's what you'd be looking for there, 2889. I haven't quite got there at this point, but, but generally fairly disappointing from a trading perspective. Okay, so let's wrap this up. If you, um, yeah, do— if you're keen on getting, um, information flow about market activities and about kind of macro data events like this payrolls, we're going to be doing a live payroll session every month. So this is the first Friday of the month at 1:30 PM. So look out for that. The next one will be start of May, of course. Also, the other good thing to do is kind of follow us on Twitter, certainly Anthony Cheung and Amplify. So if you follow @AskAmplify, then we're generally tweeting, I'd say not massively, but sort of 5 to 10 times a day. If I show you here what what we tweet will generally be the key kind of important macro factors and developments that have happened that day. Here we've just— and we tweet some— like, here's us tweeting that kind of list of investment bank forecasts for the payrolls and, and so on. So this is a good thing to kind of just keep up to date with the key, key things that happening and taking impact each day. If you want to log into our live trading room, then you can do so. We run, we run sessions like this throughout each day. If you go to trading-live.com, trading-live.com, then this can get you access into our virtual trading room. You'll get things like our weekly strategy report and so on via that service. So do please check that out. And if you're keen to join us here at the office, then please do so. Have a look at our website. We'll be running some programs as normal. We, we run programs based here at the office, and so we've run one-week programs and also 9-week program. So just check, check it out on our website, AmplifyMe.com. And let me just show you, actually, this is the home page here. If you just click on professional trading courses, then there's all the info there. So just to finish before I end the stream, we're just getting down to that NASDAQ box I've drawn. So potentially some support coming in around that area that I might have a little look at. Otherwise, unfortunately, pretty much non-event. Just looking at gold, just final point, gold's also pulling back here. So from a resistance perspective, perhaps looking at what was that sort of triple bottom for the day before the breakout. So around $1,291 technical resistance there. Okay, so that's it from the, from the desk here. That's the Payrolls Live session done. It's a wrap. We will be running one again every month. So 1st of May— sorry, first Friday in May will be the next non-farm payrolls livestream. Okay, thanks a lot, guys.
More from Anthony


Inside the Biggest Banking Stories You Need to Know This Week (Anthropic, Diageo, Private Credit)


Inside the Biggest M&A Deals You Need to Know This Week (UniCredit, GameStop, eBay, Eli Lilly)







AI Breakthrough or Hype? Anthropic’s Claude Mythos, Tim Cook Steps Down & LIV Golf Collapse