Yield curve basics
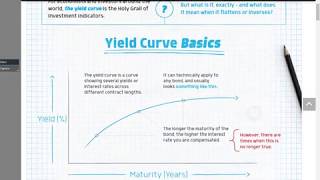
Bonds are loans that become tradable assets, with prices and yields moving inversely. The yield curve plots different maturities from T-bills to 30-year bonds, shaped by central bank policy on the short end and inflation expectations on the long end. An inverted curve, where long-term yields fall below short-term yields, has preceded every U.S. recession in the past eight cycles.
Chapters
Okay guys, so we're going to do a little chat on bonds and more specifically yield curves. So I know I talked to Stage 1, I did your bond lecture last week. Or was it before? Last week. And so we kind of did the basics. I can't remember if I did your bond lecture, or maybe Saeed did, or you did. Are you recording the session? I am, yeah. Anyway, what we covered in week 1 was very much the kind of basics of bonds in terms of, you know, just understanding that bonds is just another kind of form of debt. It's, you know, borrowing and lending when the amounts of money are incredibly large. So this is where the banking system isn't able to fund that amount, and so you get big corporations and governments using the bond markets as their channel for raising capital. Okay, so it's just a loan. It's just that we call these loans— once they've happened and the money has been lent, well, then really the contract for that loan is the bond, and that really becomes a financial asset, okay? And it's tradable, and we trade bonds, you know, global bond trading obviously is a massive, massive business. So, um, and we talked about, right, well, how does bond price, um, how does that— how's it connected to yield? But it was understanding that bond price and bond yield move in inverse directions, um, so Everyone happy with that? I think that's kind of what we've covered. Okay, and then we talked about, well, why might price move? Well, it's perhaps about the creditworthiness of the borrower changing over time. And we talked about government bonds, and we talked about government deficits, and how, you know, as you go through the economic cycle, you know, a government's deficit might increase if they're having to stimulate the economy. Let's say the economy is in recession. Well, this is where the government wants to try and step in and stimulate growth by spending more money. So fiscal stimulus. But just as they're spending more money, they're actually earning less through tax receipts because we're in a recession. So corporate profits are down and people are losing their jobs and people aren't buying as much stuff. So the tax receipts are dropping. Just as they're spending more. This creates this deficit widening, and then, well, to fund that, they've got to borrow more money, and this is where their creditworthiness can deteriorate. And it's just understanding the connection between creditworthiness and yield. So as the creditworthiness deteriorates, well, that means the ability for the borrower to pay back the money their ability reduces. Okay, so there's more risk from the lender's point of view, and it's just understanding that as the risks increase, you know, to the lender, well, then yields go up. Okay, so it's more expensive for people to borrow if their credit rating is worse. All right, so it's obviously understanding that connection between yield and creditworthiness. And we talk about those credit ratings, AAA rated, that's top-notch, that's from the lender's point of view, that's the safest loan possible because the entity you're lending to is super safe, you know, the chances of them going bankrupt is almost zero, okay, so that kind of loan, you know, the risks are really low, so yields are really low. So it's much cheaper for the borrower to borrow if their creditworthiness is really strong. So that obviously makes sense. So then as the credit rating goes down, A's, B's, when you go below BBB, you kind of move into non-investment grade. And this is just where the risks get bigger and bigger for the investor. You go all the way down to C's and then down to D, which is default. Okay. In a technical default scenario, Let's say a company goes bankrupt. Well, then you've got a problem if you're the lender. If you own the bonds, you are the lender at that point, and if the company goes bankrupt, well, you've got a problem because they're not going to be able to pay you your money back. You might get some of it back. If a company goes bankrupt, the liquidators come in. So that's a business whose service is to go into a company that's gone bankrupt and try and sell anything that has value. I don't know, let's say they go into a manufacturing company that's just gone bankrupt, right? Let's go onto the manufacturing floor, right? What machinery might they have that's worth something? Right, let's flog that. Let's try and raise as much cash as we can from selling off the remaining assets, and then you've got a pool of money, and then, right, we'll pay this money out to whoever the company owes money to. But there's a hierarchy in terms of who gets paid out, and bondholders are at the top. They're first in the queue when it comes to receiving any cash back from the liquidation process, but they don't get it all back. And as I think I mentioned to the Stage 1 group, at least I think the average last year, 2018, for corporate defaults, the average amount of money received back was 38%. Okay, so they received 38% of the money they lent, right? So they lost 62% of their money. So obviously in a default scenario, it's a disaster. So we talked about all that stuff, okay? But what we didn't really get on to— and that's, that's the basics of understanding it just from a loan point of view— but what we didn't really get on to was talking about this thing, which which is called the yield curve, and this is looking at how— this is looking at that idea of borrowing money over different periods of time, okay? And I think I mentioned that the popular periods to borrow money over would be— So let me draw my own curve here. So you might get— so did I say this? Let's put a line at 1 year. So anything 1 year and lower, so 12 months and lower, these are called T-bills. Okay, that's just the name we give to any bonds that has a term to maturity of 12 months or less, right? So popular would be 12 months, 6 months, 3 months, okay? And only in exceptional circumstances might you get 1 month. I remember Greece only being able to issue 1-month bonds because investors weren't prepared to lend to them for more than a month because they were worried that, well, if I give you my money for more than a month, my money will get back So it's only when you've got serious problems that you have to go lower than that. Okay, right, so then what, up to 12 months, then we have like 2 years, these are popular durations, 5 years, you might get a bit of action at 7 years, 10 years is hugely popular, 30 years, and then in some exceptional circumstances you might get more than 30 years. Like 75 years, 100 years. Ireland and Austria issued 75-year bonds a year or so ago. Okay, but generally we're looking 3 months to 30 years as the normal kind of typical time frame. All right, so you know, if you're a borrower that's got a high credit rating, certainly from a government's point of view, I would say you're not going to find many corporate bonds with durations out here 30 years. This is more like government bond territory. But let's say you're the US government. Okay, so you're AAA-rated apart from S&P Ratings Agency who has them at AA. Otherwise, they're AAA-rated from Fitch and Moody's, and they basically have the choice. They can manage this and they can pretty much borrow money over any time period they want, okay, because there's demand from lenders, investors, to buy those bonds. So they'll manage their loan book. So the US Treasury Department will be in charge of kind of managing their loan book, because don't forget, when you're borrowing money, well, there's a, there's a term to maturity. That's the period over which you can have that money. But then when we reach the end, we have a redemption payment that we need to make, which is the terminology we use for, well, paying the money back. Okay, so the redemption payment is when the loan reaches its endpoint, you've got to pay the money back to the lender. Okay, so if you think about it, if you're borrowing, if you're issuing loads of bonds, which the US government are, they're issuing bonds every month. Okay, well then they're going to have huge amounts of redemption payments in the calendar in the months and years ahead. Right. And they just got to manage it so that they don't have any massive spikes. They don't want loads of redemption payments all coinciding, like in one week. Let's just say, I don't know, let's just say April 2020, they've managed it badly and they've got like 50 redemption payments that have all coincided in one month. Well, then that's a problem because that's a cash flow problem, right? So they want to try and spread out their redemption payments so that they can manage their debt. So that's why they're looking to choose different durations. Okay. And obviously, from a borrower's point of view, if you can lock in funding for a long term, well, again, that gives you a lot of security. You know, you're going to be well funded for 30 years. You're going to have access to this money. But then at the same time, you know, but it's more expensive to borrow for a longer duration because the yield curve is really just describing the relationship between terms of maturity and yield. And it is the case that in normal circumstances, the longer you borrow for, the more it costs you. Okay, we'll talk about why in a minute. So there's a, there's a balance to be found here from a borrower's point of view. You want long-term funding so you're secure and safe in the knowledge you've got access to that capital for a long period. But it costs more, so we do want to borrow over shorter periods as well because this is cheaper. So you get this kind of relationship. So let's talk a bit about this then. Why is the yield curve shaped like that? So to give you— just to make this clear, right? If you borrow for 12 months, then— so this chart's not going to be to scale. If you borrow for 12 months— and so we're going to talk about the US, okay? Let's say they're about like 2.5%, maybe, for 12 months, maybe a bit less. So there the yield would be 2.5%. So that means if they borrow money for 12 months, the interest payment they need to make to the lender is 2.5% of the nominal value of the loan. And then at the end of the year, they pay the loan back. 2.5% per year, but it's only 1 year. They borrow for 10 years, well, then— actually, I'm not going to talk about the US yet. Let's say that's like 1.5%, and let's just say that's like 4%. Then what does that mean? Well, that means 4%— that the cost of them to borrow for 10 years is 4% per year, every year for 10 years. Okay, so it's a lot more expensive to borrow for that duration. So let's talk about why. Why is it more expensive to borrow for a longer period? A lot more uncertainties. Right. So the obvious thing is the— let's just call it risk. Risk is much higher because there's less visibility, there's less certainty. You know, when you're lending to a government for a year, you know, we've got a pretty good idea on the economic cycle and where we are, and we've got some visibility a year into the future as to how this economy might perform. So because we've got— there's obviously always the risk of anything can happen at any moment. But by and large, we're fairly confident that in the next 12 months, these lot aren't going to go bankrupt. So there's less risk. So we're prepared to lend to them for a cheaper or less return. So it's cheaper for the borrower. But 10 years, well, look, you can go through a whole cycle. 10 years. Well, who knows, in the next decade we could have another financial crisis that was worse than the one in '08-'09, right? Who knows? So there's just more risk. So the investor, the lender, needs more money, needs more return to kind of make it worth their while to lend them that money. Okay, what else? Why else? There's one other kind of very key important factor here that results in the yield curve rising as terms of maturity increases. Inflation is spot on the money. It's this thing called inflation. Okay, so, so here, this is the concept of the value of money, uh, being eroded over time. The value of money decreases over time. Okay, so if you take a, uh, so let's say we're in an inflationary system. Let's say we've got a really low, stable inflationary system where inflation is around about 2%. So this is what developed economy central banks are trying to achieve. That's their inflation target. They're trying to use interest rates quantitative easing, perhaps, to try and engineer inflation constantly at or around 2%. Okay, they're trying to do that. It's a very difficult job though. Sometimes inflation is too high, sometimes it's too low. But the important thing about inflation is— the important thing about inflation Let's just take 2%. So let's say we have £1,000, okay, cash. Now we could walk into the shop and buy— let's just say we're gonna buy— we're gonna buy a sofa for £1,000. All right, so we go into the sofa shop, it's £1,000, here's my cash. But then let's say we change our mind, actually we have second thoughts, last minute we say, you know what, I'm not going to buy it, sorry, put my cash in my pocket, walk out. Let's say a year later I think, actually I'm going to buy it, decided. So I go back to the shop, get my £1,000 cash, there you go, but the guy who owns the shop is going to say, sorry, that's not enough money. The value of my £1,000 the value of it has gone down. It's the same amount, it's £1,000, but I can no longer buy the sofa because the sofa's value has gone up because inflation has meant that the price of goods in the system increases over time. So let's say it's gone up by 2%. Okay, well, the, the sofa is now £1,020. So my £1,000 has lost value relative to the cost of living. Okay, sometimes inflation or certain economies, certainly emerging markets, inflation is going to be way higher than 2%. Okay, so the higher inflation is, the more rapidly my money loses value over time. So think about it from an investor's point of view when you're lending money. If I'm lending money for 10 years, well, by the time I get my 1,000 back in 10 years' time, well, it's going to be worth a hell of a lot less than it was when I lent it because the cost of living has gone up. You know, that compound interest effect, right? And I don't know, it might be that really in the kind of— here we're going to— well, I'm not going to get into kind of discounted cash flow stuff here. But let's just say £1,000 in kind of 10 years time is actually— would be more equivalent to something like £700 in today's money. All right, so if I lend £1,000 to someone, the value of that to me in 10 years' time is more like £700. So hang on a minute, I'm losing quite a bit of value here, so I need more return. If you want me to lend to you for a longer period of time, I'm going to need a higher yield to compensate me for inflation eroding the value of my money. Yeah. So say you're lending them for a year. Yes. You wouldn't want it at 1.5% yield, would you? Because then you could just sort of keep the money. Who wouldn't want it? The borrower or the lender? The lender. Right. I wouldn't want— 1.5%. Why? Because inflation is 2%, your net loss is 0.5%. Unless the inflation was not there. Absolutely, so this is a very good point. You know, you'd want to see 1-year or 12-month yields, you'd want to see that at or above the rate of inflation, right? But it's not as— yeah. Yes, you're right. Sometimes it's not as straightforward as that because sometimes we use bonds, investors use bonds to protect capital rather than necessarily trying to increase and generate a profit. It can actually become a mindset. Let's say we're in a crisis now, we're really panicked about losing our money. If we're invested in, we've got Apple shares, well, that's a problem. So we sell our Apple shares and we want to put it somewhere safe. We want to put our cash somewhere safe. There's nothing much better than a US government bond, for example. So sometimes investor mindsets around safety rather than return. So you can sometimes— you definitely do see bond yields lower than inflation, and indeed we've seen that. The last decade, and certainly in some— like, take German government bond yields, the whole curve is well below the rate of inflation. So we do get some— and you will come on to that, actually. So, so this is why, right, generally risk and inflation. So what moves— what, what are the factors that have the largest influence over prices of bonds at the long end of the curve. So we talk— we have this language, we call this the long end and we call this the short end, okay, when we're talking about the curve, the yield curve. So that's just a reference to the duration or the term to maturity of these, these loans, these bonds, okay. Now on the long end, what has the biggest influence on bond prices at the long end? Well, it's inflation. So let's say inflation data being announced, um, actually is a very important data release if you're trading 10-year government bonds, for example. You know, if those inflation figures come out and they're way higher than expected. So here's a question. Let's say inflation's released way higher than expected. How would the long end of the curve move? Would yields go up or down? So who thinks— let's have a think, right? Inflation's announced way higher than expected. Who thinks— put your hand up if you think the yield curve will go up. Who thinks the yield curve will go down? Okay, we've got a good, good spread. All right, so some going for one, some going for the other. So this is why bonds are a little bit more complicated Because sometimes we talk about price and sometimes we talk about yield. It's just their opposite. When you're reading an article in the FT, sometimes the person who's written it is just talking about yields throughout the article, and they're talking about bond yields being record ever lows, for example. Then you might have another article talking about bond prices being at record ever highs. We're talking about the same thing. Record highs or record low? Which is it? Well, it's both. So you've got to— is it yield or is it price? Well, here this is yield, right? Now, what did I say? If inflation goes up, well, that's bad news for the investor. So we need more yield to compensate ourselves. So the yield rises. So inflation goes up, the yield curve goes up. That means prices go down. So prices drop off higher than expected inflation. Go short T-notes, OK? Because prices are going to fall as yields rise. So definitely inflation is the key influencer on the long end. But inflation data is not so influential on the short end. Really, down here, it's more about interest rates. Central bank interest rates would be the kind of key driver of yields on the short end. And when you're talking about the central bank's interest rate, well, that's actually— we often call that the reference rate. And that is a reference rate for banks to reference off when they're setting the interest rates on loans that they're providing out into the economy. But that reference rate is, is for a 2-year loan. All right, so central bank interest rates very much, you know, very directly influential on 2-year durations. But of course, it's not just the 2-year bonds that goes up and down. Of course, that has a spill-on effect both ways. Okay, but definitely The short end of the curve is more sensitive to central bank interest rate changes. The long end of the curve is more sensitive to inflation. Let me make this clear. The whole curve is sensitive to inflation, but the long end more so. The whole curve is sensitive to interest rates, but the short end more so. Did you have a question? Yeah, fiscal policy. A short period of time? It can, yeah, because we're thinking about supply. So let's say Trump wants to build a wall, Trump wants to spend more money on the military, let's say he wants to cut tax quite aggressively. Well then this means the US government is going to have to borrow more money, they're going to issue more bonds. There's going to be more supply in the future. So if there's more supply, price goes down. Yeah, correct. Which makes sense, right? If you're the borrower and you want to borrow more, well, that's— in the end, it's got to have a negative effect on your credit rating, hasn't it? Which means there's a higher risk you're going to go bankrupt, which means, well, yields will be higher. Yeah, and also, how about— so we talk about inflation and the loss in value of money. So how about we have an equilibrium where interest rates are equal to inflation? So then I would like to see, especially in the short term, a bit more flattish curve, right? Good. So let's now move on. This is the basics. This is the— this is what we call the normal yield curve. Okay, when we have normal economic conditions, you should expect to see the curve like that. So let's have a look now, because this isn't a fixed thing. This curve— yields move, right? Prices are moving. So what we do as investors, we look at how is the yield curve changing shape. We're going to talk about this. Let's go back to this. So here I've got— this is a really good— I'll get Massi to maybe— I'll get him to email this link. This is quite a really great short sort of piece explaining the yield curve. So we've just covered that, alright? The yield curve is normally shaped like that, but then we talk about the yield curve changing shape, okay? So we talk about normal, we've covered that. We then talk about flat, and then in certain very unusual cases we talk about inverted, all right? So the yield curve can change shape. Now Let's look at this chart, which is looking at how the yield curve in the US— so the US's yield curve. So everyone's got their own yield curve, right? You know, the German yield curve, whoever's got bonds, whoever's issued bonds over different durations, well, they have a yield curve. All right. And it's just plotting what's the yield on these bonds as the duration changes. This is how the US yield curve has changed shape in the last 5 years, okay, and you can see it goes up and down. So we talk about the yields going up and down, but then we talk about the curve steepening or flattening. Okay, these are the words we would use. So if you take 2014 here, well, that is fairly normal looking in in terms of the shape of it. It's not normal in one aspect, though. And that is that— look at the kind of yields over here. So whilst the shape is normal, it's actually very low. But the whole curve is very low. If you go back before the crisis, go back to 2005, 2006, well, then 10-year yields were at 5%. Okay, and the curve was shaped like this, but it would go from 5%, let's say, down to like 2% down here. Same shape, but the whole curve just kind of shifted down. That's because we're in the post-crisis era of zero interest rates. Okay. But otherwise, the shape of that's quite normal. But then check out what starts happening. And here we talk about the long end and the short end. So look what happens on the long end. Well, look, 2014 to 2015, the long end goes down. Yields drop on the long end. Look what happens on the short end. They actually go up. That's very unusual to see literally opposite directions. But the curve flattened. It became more flat or less steep. 2016, well, look, the 10-year goes even further down and actually remains pretty fixed over here. So check out this— in, in 2 years, the 10-year yield dropped from 2.5% to 1.5%, whilst the short end went nowhere at all. So why did that happen? What could possibly make that The expectation of the economy in the long run is safer, so like hitting growth is less of a risk in the long run. Okay, interesting. Well, the easy one is of the short end. Why is the short— why has the short end not moved? Well, it's actually slightly gone up, but it's all about interest rates, remember, on the short end. The Federal Reserve interest rate And what was happening in 2014? We're still at zero. What was happening in 2015? We're still at zero. What happened in 2016? Right at the end of that year did they hike. So you've got a slight uptick here, one quarter point hike actually. They did a quarter point hike in 2015 and a quarter point hike in 2016. So it's marginally gone up because of an interest rate hike. But the long end has gone quite significantly lower. This is more about demand, demand for US bonds, because if demand is increasing, well, prices get forced higher and yields get forced down. Right. It's a complicated one here because by certainly in 2014, the Fed was still pumping their QE program. Quantitative easing definitely depresses yields more on the longer end. That's because the Fed are printing money and buying huge amounts of these bonds. So demand goes up, prices go up, yields go down. So one reason the yield curve's this low on the long end is because of Fed QE, all right, since the crisis. The short end's low because rates are at zero. OK. So a bit more QE coming in, but also even down at 1.5%, what happened more from a QE point of view, we had Europe. The ECB started to properly roll out their massive quantitative easing program, which had a huge impact on yields in Europe. Yields went through the floor. OK. Yields very low in Europe. So that forced some investors out of European bonds and into US bonds because relatively, even though at 1.5%, at that point yields in Germany at 10-year levels were zero. So what do you want? You want to buy German debt for zero yield? Or actually, let's sell that and I'll buy US debt for 1.5%— thanks. So it forced some international money into the US market because their yields relatively were higher than Europe and higher than Japan. Why would anyone bond, uh, fund a bond that's getting zero yield? Yeah, well, that's indeed a very good question. There could be two reasons. Number one is you could have deflation. If you've got deflation, right, then actually your money's getting more valuable over time. So fine, Take my money. I don't need any interest, thanks. Give it me back in 10 years. Great. It's more valuable. So if there's deflation, zero yield makes sense. But that's very rare, deflation. Japan. One other— well, okay. So Japan, that's why Japan's yields have been at zero for a couple of decades. That's actually— I thought of another reason. No, but hang on, I was also going to say then a crisis. If you're in that crisis situation and actually I want to— I just want safety, it's not about generating a return on investment, it's just about safety. So I'm fine, I'm going to buy German bonds at zero because that's the safest place I could possibly put my money. In the shorter term, what happened during these years was a lot of bond trading was nothing to do with yield. It was more about price, making a profit from price change. So short-term trades. I'm going to buy German bonds with a zero yield if I expect in 3 months' time that yield to be minus 0.1. Because then the price has gone up. Great. I can sell and make a profit. So there's that as well. So look, this is flattening. OK? Then look what happens. 2017. So let's go from this, this kind of flat, flat here, right? Then what happens? Well, the short end goes up and the long end go up by about the same amount. So 2017, the curve's not changing shape. It's staying flat but just shifting higher. And that's because now the Fed are in their rate hiking cycle. Okay, the hiking rate, 0.25%, 0.25%, 0.25%, this is inching up and up and up. Okay, and then over on this side, you're actually starting to see the economy start to pick up and inflation's beginning to rise, so the long end shifts higher as well. Okay, then what's happened since 2017 and 2018, you've had this carry on rising. Why? Fed, keep hiking. 4 times in 2018. 3 times in 2017. So the Fed have forced up the short end of the curve. Fed interest rates, it's now 2.5%. So that's where the short end of the curve is. They've literally just forced the short end higher. Now, what's happened on the long end? Well, it's gone up, but not by as much. So you get further flattening. And it's almost now flat. And it's gone up on the long end because we did get inflation. The economy, certainly in 2018, the economy was flying. The US was really strong momentum. We thought inflation is inevitably going to come, which is why the Fed are hiking rates. And so the long end was going up, but not as fast. Because you've still got European yields ridiculously low. So there's like a, an above-average demand here because rates are relatively higher. So just the long end didn't go up as fast. Okay, let me just flick to a different graphic. So what we like to do is compare the spread between the 2-year yield and the 10-year yield, which all that is, is doing— all that's measuring is the steepness of the curve. Okay, do you have a question before we look at that? Yeah, but wouldn't you have concerns that it would invert? Yeah, let me talk about that in a sec. So this chart here is looking at the spread between the 2-year and the 10-year. Okay, so the steepness of the curve— what's the difference between the 10-year yield and the 2-year yield? As you can see what's happened through the Fed's hiking cycle, you know, the end QE through the hiking cycle, the spread has got narrower and narrower and narrower, and it's at the lowest point it's been since before the recession. Okay, now you can see there's a line at zero here. Yeah, you can see. So sometimes the curve inverts. That's where the 10-year yield actually becomes lower than the 2-year yield. So we talk about the inverted yield curve. It's a very unusual situation. What, what might lead— what could possibly lead to that happening? Just scan down here. This is actually that, looking at that spread, um, as well as— that's the S&P, I guess. Yeah, so the S&P versus the yield curve. But sometimes they got an inverted— sometimes we actually get the curve inverted. So why might the curve invert? Right, so, okay, so what happens? What happens? How does the curve invert? So let's think— well, let's just think about the short end first. Well, the short end stays high, right? That's because interest rates are at the top of the cycle. So the Fed have just raised rates to 2.5%. So that anchors the short end of the curve at 2.5%. Now, is that the top of their hiking cycle? Maybe. Now, if it is, right, what then tends to happen is investors who are looking into the future are starting to think, well, this economy's at the top of the cycle. We're now actually hitting the late phase of the cycle. We can see the recession is coming. 12 months. 12 months out, 18 months, we reckon recession. So let's start preparing for that. The investors start preparing for the recession. What do you like to buy if you think there's going to be a recession? 10-year bonds. So you get demand starting to ramp up on the longer end of the curve, which drives the yield down. Demand drives the price up, yield down. So the short end's anchored. By the Fed rate, and this long end starts to drop because investors are starting to prepare themselves for a recession. Now, the whole, the whole beauty of all of this is that investors behaving in that way actually contribute to the recession happening. If we're worried there's going to be a recession, our behavior will make sure there is one. Okay, that's from a bond trader's point of view. It's also from a consumer's point of view. If I panicked, oh my God, there's going to be a recession, I'm going to stop spending, I'm going to start saving more money, I might lose my job. But that in itself creates the recession. So it's all behavioral. Us human beings, we're kind of— we're the problem in terms of our behavior. Yep, it's kind of like guessing the recession earlier, and then when you see interest rates start to decline, you kind of position yourself, okay, I'm buying bonds. Yeah, well, you perhaps don't want to wait for interest rates to start to decline. Yeah, if you think rates are at the top of the cycle, yeah, right. Why does the yield curve changing shape like that— why does it create— help to create a recession? Well, a normal yield curve is like this, okay? And if you think about banks, so the banking system, what's their business model? Well, a bank's business model is to make money from lending, okay? But they need— where are they going to get the money from to lend? Well, they borrow it. Central banks. Well, okay, yes, but the normal function of a bank is they take deposits from consumers. You know, we've all got a bank account and we've got money in it, hopefully. So what happens? Let's say I've got £2,000 in my bank account. Well, there's no, you know, there's no like box in the safe, in the vault with my name on it with like £20 notes in. Banks pool all the deposits from all their customers and this pot of money they lend it, okay, but if you think about my £2,000 effectively I'm lending that money to the bank but for very short-term periods because really I could go to the bank at any point and withdraw that money. It's almost like a day-to-day loan, right? Every day I say, alright, you can have it for today. "Tomorrow? Yeah, you can have it tomorrow." It's like the duration of the loan is like one day, okay, if you want to think about it like that. So banks— think about how much that costs the bank. They want to borrow money from me, the depositor. Well, it costs them a really small amount. These days it costs them nothing because the interest rate on your current account is zero. Those who remember before the crisis We used to get some interest on our current account, not much, like 1% interest. That's the bank paying us. These days it's zero, right? But the point is the bank borrows money on the short end from depositors. They then lend it on the long end, okay? So the banks are borrowing here and then they're lending out here. And they're lending— a good example would be a mortgage, for example. Which is these days like 30 years. Okay. And they're lending at rates up here. So they're borrowing on short term and lending on the long term. The banking system makes a profit margin is really the spread between the 2-year and the 10-year. It's the spread. And the bigger that spread, the more profit they make. So have a think what happens when the curve starts to flatten. Well, for banks, it's a disaster because their profit margin gets— like, the curve flattens now like that. Well, their profit margin is gone. So it makes it less profitable for banks to lend. So they start to reduce their lending. But unfortunately, the way our economic system works If banks stop lending, the whole system shuts down. That's what happened in the crisis. We called it a credit crunch because credit, that's, that's availability and the cost of borrowing money, because that's the functioning of the day-to-day economy, is based on easy and cheap access to credit. Okay, but if that stops, well, then the economy collapses. So banks, when the yield curve flattens, banks will be kind of forced into lending less. And what happens if the curve inverts? Well, then actually you get the scenario where it costs— there's not only is there no profit now, they'll lose money if they lend. So then they definitely stop lending, which means you definitely get a recession. And here's the stat to kind of worry you every time the yield curve— oh no, it was on this— every time the yield curve inverts, what happens? These bars, by the way, they're recessions. So the yield curve inverts, recession. The yield curve inverts, recession. And in fact, if you go back to the 1950s, The last 7 or 8 recessions, every single one is preceded by the curve inverting. Every time. That's why we call the curve inverting the best recession predictor that there possibly can be. Every— the last 8 times the US curve has inverted, we've then had a recession. Now, it's not immediate, and the lag can be different, but the lag on average is about 18 months. So when the curve inverts, 18-month recession for the last 8 times. That's why we're so obsessed at the moment in monitoring this spread and worried about is the curve going to invert, is the curve going to invert. If the Fed keeps hiking, well, they're going to force the curve to invert, which is really going to maybe force a recession, which is one of the reasons why they've stopped. They've stopped hiking. One of the reasons is for that. They can't afford the short end to go any higher. So yeah, questions? In, in 2008, was the eurozone weaker than the US dollar before the recession? Because now we're getting to a point where Europe is like, they're falling more into recessions, but the US is inflating. The US dollar is inflating and everything else is deflating. Yeah. So this time might be a bit different because at this point Europe is a lot weaker than the US. So this time US dollar might, instead of deflating as much as it did in 2008, might go the opposite way because everything's pointing to the US dollar. Yeah. But what would that— how would that affect bond? Because it would be a whole different unknown scenario that hasn't really happened before. I think what— right, so that your last point's correct. Correct. So the one thing about the financial crisis, so epically, spectacularly large, and because— I don't know, many reasons— but the way the eurozone's set up and the ECB, Europe basically had a double crisis. The US didn't. The US crisis in '08, '09, then recovery begins. Europe crisis in '08, '09, recovery begins, but oops. Crisis, double crisis, 2010, '11, '12, okay? And it put Europe's economic cycle— kind of knocked it out of line. So we've got the situation where Europe is way behind the US, right? So you've got Europe's economic performance being very different to the US's. So the divergence is huge. Um, so you're right in probably expecting that the US dollar may well appreciate this time. I mean, it certainly appreciated in 2018. Then we have— we've had a bit of a breather on that trade for a few months because the Fed have decided to stop hiking. But if you get a continued deterioration of the European economic situation and the US stays constant, then yeah, the dollar will appreciate. But they're connected. I don't know how long the US economy can stay strong if Europe's in recession, because they are— you know, the US does have some dependency on the global system, right? So it could be the case that Europe hits recession and the US momentum slows, in which case you're not seeing a divergence, they're both dropping, and therefore it might be more sort of exchange rate neutral. But how it might have an impact on bonds, well, You know, I think from an international investor's point of view, if you're in Europe, well, US bonds will get— if you think the dollar is going to appreciate, well, that's a great trade. I buy US bonds. Not only is the US economy in better shape, but the dollar is going to appreciate compared to my euro. So I'm going to make a profit from the exchange rate. So it might see money flow into US debt, which will only help the curve to invert because demand will increase, driving the long end down. And if the Fed aren't going to start cutting— the Fed don't start cutting, well, the curve's going to invert. So we're worried. This is what we're worried about at the moment. This is very much long term, right? It's looking about, uh, longer term economic trends, and the curve inverting is an absolute nailed on Classic for saying, right, we're late cycle, we're going to have a recession. Would you say the world's more leveraged on the US dollar than it was in 2008? Is it more leveraged on the US dollar as the world is more crowded than it was in 2008? Yeah. And a lot of that's just to do with emerging market corporate debt being dollar-denominated. More than 50%. Of emerging market corporate debt is dollar-denominated. So if the dollar appreciates in value, it's a nightmare. Yeah, which is what happened in 2018. The dollar really ramped up in value and we had a bit of a— like FX crises, you know, Turkey, Argentina, you know, Brazil, Russia. There's a hell of a lot of big exchange rate moves that caused cause a lot of problems. But it's all linked because if the dollar goes too high, it has such a negative effect on the rest of the world that then that has a knock-on negative effect to the US economy. You think this might be the first time where the world starts to devalue the US in this recession? I don't know. Yeah, I mean, you would probably— if you look at things like the how much of the US— what proportion of the global economy is made up of the US? Well, that proportion is shrinking because emerging markets are growing faster. So yeah, naturally you tend to go through like a 50-year cycle in terms— uh, hang on, no, more than that. Sorry, when— sorry, hang on, when, when, when a superpower economy peaks in terms of its proportion of the global economy, it tends to be about 50 years later that we move away from using that currency and properly move on to the next. So, you know, it's like, so when did the US peak? Well, it was probably a decade or so ago, or maybe 20 years ago. We're only— we've still got 30 years. On those averages for the dollar to still be dominant reserve currency. Well, what's the problem though? They, um, talk quite a lot about America going through recession. It's going to happen, it's not going to happen. You get different views on it. Yeah, we're a year away and so on. Um, their GDP's still at 2.6%, which Europe's at 1%. So you'd like to think if Europe went into recession, they're still quite a way away from that. But if you look at that curve, yeah, we're not too far. Yeah, well, it hasn't gone negative, but it's going in that direction. Certainly the trend suggests that it will. Um, but don't forget the thing about the Fed. So yeah, Europe's the problem because Europe's— certain parts of Europe's in recession already, growth is slowing, and the big problem is that central bank interest rates are still at zero. They've only just ended QE, right? The Fed, at least they've got some tools to fight a recession. The Fed can cut rates. They can cut rates by 2.5%. The ECB can't cut rates. That cutting of rates, that's a stimulative kind of measure. So Europe is the problem. Um, it's just how much of a kind of spillover effect it has on the US. So that's it. That's all I wanted to kind of talk about. You know, get this onto your agenda, and you might hopefully better understand now why, you know, when they talk about on TV— it's one of their favorite topics, you know, is the curve inverting or not— well, this is what they're talking about. And the reason why everyone's so obsessed with it is because of what's happened every time in the last 8 times. Inversion, recession. All right, that's it. Thank you.
More from Anthony


Inside the Biggest Banking Stories You Need to Know This Week (Anthropic, Diageo, Private Credit)


Inside the Biggest M&A Deals You Need to Know This Week (UniCredit, GameStop, eBay, Eli Lilly)







AI Breakthrough or Hype? Anthropic’s Claude Mythos, Tim Cook Steps Down & LIV Golf Collapse