A Salesforce admin sets up Einstein Analytics by enabling it in Setup, assigning permission sets, and creating a pre-built Sales Analytics app. The demo covers scheduling dataflows (like hourly runs starting at 5am), building dashboards for sales reps, and adding team leaderboards and pipeline analysis.
Questions this video answers
Einstein Analytics Platform admin; Einstein Analytics Platform user; Sales Analytics admin; Sales Analytics user; Service Analytics admin; Service Analytics user; Event Monitoring Analytics admin; Event Monitoring Analytics user.
Run hourly starting at 5:00am, repeating every 3 hours, weekdays only, with email notifications on warnings.
Chapters
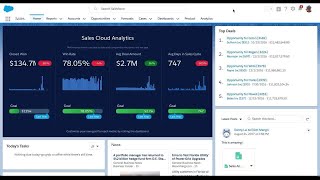
Let's get started with basics. Setting up Einstein analytics as an admin whose company recently purchased Einstein analytics, my job is to enable the feature and assign users. I can do this quickly through Salesforce Setup. First I look for the analytics section in Setup, click Getting Started and enable Analytics. In doing so, a bunch of processes ran in the background to actually start setting up the system. One of those processes created a bunch of standard permission sets. So now I want to make sure I have admin privileges to use Einstein Analytics. So I'm going to look at these standard permission sets and I can see I've got Einstein Analytics Platform admin, Einstein Analytics Platform user. I can see Sales analytics admin, Sales analytics user Service analytics admin user, also Event monitoring, Analytics, admin and user. So I would like to assign myself the admin functionality. If I go under system permissions, I can see all the things that I can do as an admin. So these are all the functions I can do within Einstein Analytics. I'm going to click Manage Assignments, I'm going to add myself done. But also I want access to create some of the out of the box apps as well because that's going to get me started really quickly. So quickly I was able to assign all these permissions to myself and now I can get going through Analytics Studio. Upon launching Einstein Analytics Studio, things look a little bare. So I think I should create some apps. So when I go to create I can choose app. I can see a list of all of the pre built apps I can see based on my permissions. But let's start with Sales Analytics. So Sales analytics is going to detect your optimal sales cloud settings on this page. And then on the next page I can choose to do a basic setup. Once the app is completed, I can see all of the content in here. I get a set of pre built data sets that joined all of my most important sales objects from Salesforce. I get a set of lenses that lets me explore those data sets so I can uncover the insights I'm most interested in. And I get a set of Persona focused dashboards that lets my users slice and dice their business. I just went from zero to Insights in a matter of minutes. Now that my app is created, I'm ready to schedule my data flow. I can do that from the Data Manager section, I simply find my data flow. Click on schedule. I can schedule my data flows weekly by day, hourly or even monthly. I can choose the time that I want that data flow to start and I can even send myself an email notification. In this example, I want to actually set this data flow to run hourly starting at 5am because that's when my first team members start working. And I want to run it every three hours so I know my data is most up to date. And I want to run it at this schedule on weekdays because I know over the weekend they're not going to be logging in the system. And then I want to send myself a notification on warnings, so I'm going to save this. And now I know that my app will be refreshed with data every three hours so I can tell my end users that the data they're looking at is at most three hours old. Finally, I'm ready to share this out with my team. Now that my app's been created and I and I've shared it out with my end users, let's look at sales analytics from the end user perspective. Remember, we built Persona focused dashboards for the sales rep, sales manager, sales operation, and even sales executives. So let's see how they will see the app. So as a sales rep, when I log into Salesforce immediately, I can see my sales analytics embedded dashboard directly in my homepage. It gives me highlights on my top level KPIs that I'm most concerned about for this year. If I go into the analytics tab, I can click on the Sales analytics app, see those same KPIs, scroll down and go into my sales rep overview. So right away I can see how I'm tracking against my quota, my most important metric that I'm concerned about. I can also look at other metrics that I know my manager is looking at, such as how much I've closed, how much I'm opening in new pipe, and how many activities I've been completing. I can see how they compare against the same time last week to see if I'm making any improvement. Right away I can see that there's a gap. I'm not going to hit my quota this year and there's something I have to do. I can look at some deals that I already have in my pipeline, but they're not going to really help me at this moment. So I need to actually look at my white space. I need to look at all of my accounts and see what products I'm selling or not selling. So I can identify some areas where I can actually upsell or cross sell. So as I scroll down I can see areas where I'm actually selling some products. And anytime I see a blank space, I know that I haven't actually sold anything or I don't have any open pipeline. So in this case I want to actually focus in on this account. I can take action directly from the analytics app, but I actually want to open this record to see some of the highlights for this account. One of the other things that come out of the box with sales analytics is are these embeddable dashboards so I can see from an account perspective some key metrics such as average sales cycle for that account, what's my win rate, how much open pipe do I have, what's my average discount, what products am I selling, or even if there's any open cases. As a sales manager, I'm really interested to see how my team's performing. So when I go into sales analytics, I'm going to go first to my team leaderboard dashboard. On the left I get a great view of my team. At the top of the list is the top performer and as I go down those are the people that aren't performing as well. Based on various KPIs, I can change my KPI to close one open pipe, quota attainment, remaining quota, et cetera, and I can really have a good one on one with my team. But also what's interesting isan analytics lets me take notifications. So I might want to set a notification when I'm going to hit my metric for the quarter. I can notify me based on certain conditions and I can set the frequency as far as when I get those notifications. So if I'm not meeting my mark I will still get an email based on how I'm performing against certain KPI. Additionally, I might want to actually talk with my team interactively on this dashboard. So Einstein analytics gives me this ability to actually annotate certain things. So let's say I'm looking at my pipe generated. I've got 20k for this quarter and I want to talk with my team about this and I might want to either ention I can include someone so let's ention Bobby, I thought we had a metric of 50k this quarter. Let's attach a screenshot so we can see it in chatter and let's share. And this annotation is actually going to live as an open action item on this dashboard so that when Bobby comes to this org he can actually see that there's an action for them. Additionally, I might want to share this entire picture to chatter. Let's actually post this to a user. And let's see what that looks like. Let's go into chatter. And right here you can see I posted to Bobby a picture of the dashboard, so you can actually go in and see what's going on. But also, as a manager, I'm really interested in how my team is performing against their pipeline. Earlier this quarter we had a meeting and we knew the pipeline was 150 million and today I'm at 116 million. But I don't really have visibility into what has changed just looking at salesforce. So that's where Einstein analytics gives me the ability to take my opportunity history and bucket things. So I know exactly what my team is doing. Some people are creating new opportunities, some people are expanding, some people are moving deals out. Some deals have been reduced in size, some deals are close, won and closed lost. And that's where I'm left at 116 million in pipe. But wouldn't it be great to see what are the deals that are moving out? Well, if I click on this bucket, I can scroll down and I can actually see the individual deals that were originally set to close this quarter and now are pushed out and I can take action on these. I can also look at my forecast product, white space, team benchmarking, and even team activities from a sales operations perspective. I'm very much interested in sales process performance and whether or not people are actually following the process that we've set up. So if I click on the sales stage analysis dashboard, I can see how my deals are doing as they're moving from stage to stage, how long they're spending in number of days in each stage. In blue I can see the historical average, how long deals are spending in particular stages. In purple, I can see based on my open pipeline, how are things performing Immediately I see that deals in the ID decision making stage are actually taking longer than historical average. So I can actually click on that to look at the deals that are stalled. So these are deals that are actually taking longer than my historical average. Again, I can look at them and take action. But additionally I can see are my reps following the sales process. As I click on a particular stage on the right side, I can see how the deals are moving from stage to stage. So this becomes the from stage and this is the to stage. I can see that some deals are actually going directly to close one when they're in ID decision making. So people are clearly not following the sales process.