Tableau Keynote: Reimagining Analytics for the AI Era | Dreamforce | Salesforce

Tableau announces Pulse, a personalized insights digest, and Einstein Copilot for natural-language data exploration. The Texas Rangers used data and AI to drive significant revenue growth. New integrations connect Tableau to Slack, Salesforce Data Cloud, and Tableau Prep.
Questions this video answers
Over 160 new capabilities.
20th anniversary (20 years).
Less than 10%.
87% of leaders said they are investing more aggressively.
More than 3 million people.
Chapters
All right.
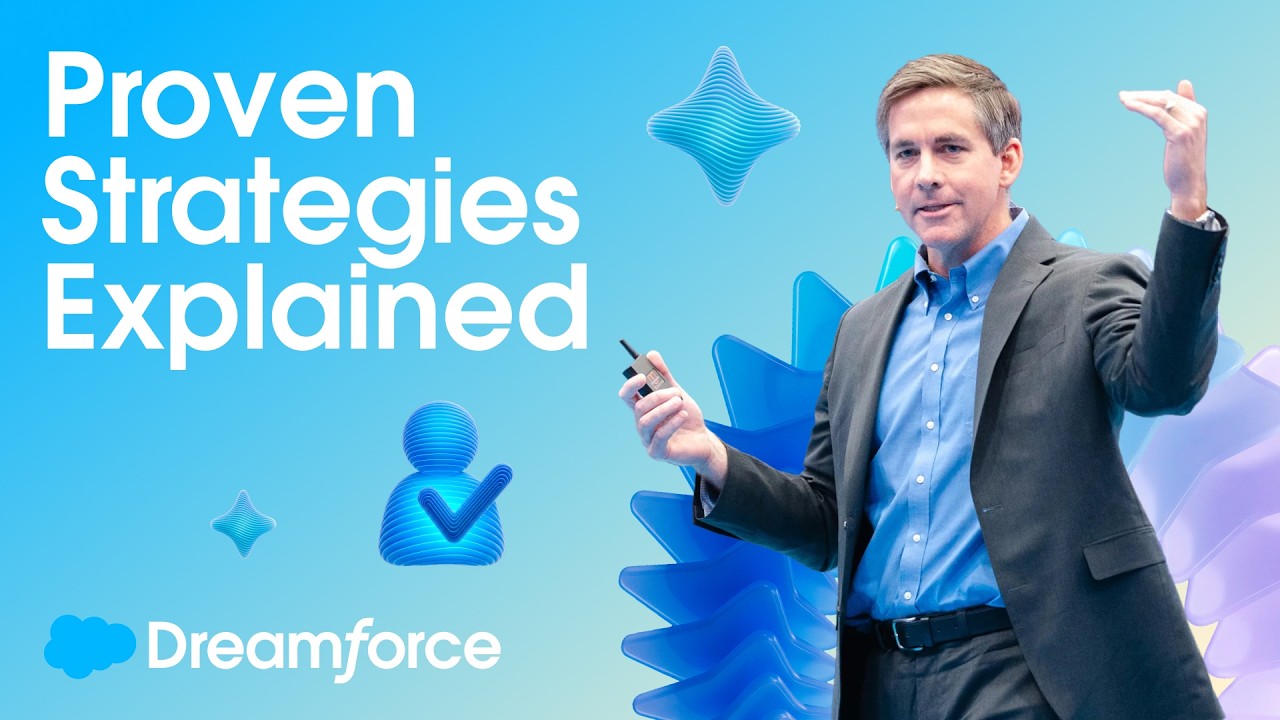
Hello. Welcome, everyone, and come on in. If you're still coming in in the back, I think we have roughly 2,000 people in the room here. It is going to be an amazing day, I promise you that. And it's going to be amazing conference for you. Hopefully you had a chance to see the keynote right before this. I also thank you for coming over here because I know it's probably a bit busy to cross the street and go across. What street is that? Fourth Street. And so thank you for getting here. It's going to be a great day. But what I'd like to do next, and I realize I don't have my clicker, so that's a great move, is to thank you. And I want to say that it is very important to us not just to thank you for being here and for spending time with us, but to thank you for being with us on this journey. At Tableau, we've been very focused and we'll talk about a lot of that today on customer success and innovation. And you are all part of that if you are a customer or a partner or a community member. I know we have our community members here. I've seen a few of them in the front, which is awesome. Let's give them a round of applause. And of course, our amazing employees who've put so much work into getting to this point as well. So thank you and we will move on. I want to talk a little bit about as well what we've been doing over the last 12 months, really, since we got here, you know, between now and 12 months ago. As I said, we've been very busy. We've been laser focused on delivering customer success and innovation. We've shipped over 160 new capabilities, things like embedding playground, things like data cloud. For Tableau, you heard a little bit about Pulse today in the main keynote, you're going to see more today. Things like HIPAA compliance, important needs for our healthcare and life sciences customers, and on and on. And all of these things you'll be able to see more of here at the conference and of course, by speaking to some of our folks. So that's really exciting. Now, what's also exciting is to say that we just celebrated our 20th anniversary. And at Tableau and Salesforce, we have spent the last 20 years really revolutionizing analytics and business intelligence. And we owe that all to you, everyone here in the room. Now, of course, we also became part of Salesforce roughly four years ago, and that has also been a journey that we are on. Lots of Amazing things have happened since then. If you look in the keynote, some of the announcements that were made today with Data Cloud. And also if you think about, you know, one of the things we're seeing in this new AI revolution is really this pull. The pull to do more than just focus on the data professional, the IT or analyst, right? The person who is really doing all that hard work. Customers are telling us to do more, to go beyond. And so really, that is sort of defining our next chapter. Our next chapter is really all about everyone, all of you and all of the people that you work with, because it's not just having data with your analysts, it's also having data and being able to be data driven for everyone inside your company. And we'll talk about that today. And of course, this only, as I mentioned before, accelerates this need, becomes more urgent in the world of the AI revolution that we're going through now. This is all exciting, and I am very lucky to be up here as the CEO of Tableau, talking to you about where we're going, because it's exciting, right? Who wouldn't want to do this? What's not as exciting is the amount of data that's coming at us. There's so much data coming at us every day. Billions upon billions of gigabytes of data. And this data, it's collected, it's stored, it's processed, and it is consuming us. There's so much information that is out there. This data also continues to be in different places. And when I say that, I talk about this concept of it being disconnected. All of this data can be in a data warehouse. It could be on your phone, it could be on some type of local device, or maybe it's on premise. It really could be anywhere. And that is concerning to me as the CEO of Tableau, because we want to help you, of course, solve this problem. Now, I think it's also important to talk about data is so important. As you know, we're here to talk about it. I'm wearing a shirt. The shirt says, like, I love data. I have shoes on it. I love data. A lot of us love data. And I keep asking the question of, like, why do we love data so much? Why are we so consumed by all of this data and we're consumed by this data? Well, Tableau has always been about data. We are data people. And, and I'll say again, thank you to our community, to helping us get there. We are data people. But not everyone has been on this journey for 20 years. And so it's Important to give you an example. I like to think of an example from my personal life and from our personal lives in general, because our personal lives, well, they run on data, too now. They run on data. How many of us have had an Apple watch or glucose monitor, sleep ring, maybe give me a show of hands that you've had some type of device that tracks your personal data. Well, that's great because your data tells you what you're doing, what's going on, is it going up or is it going down? It allows you to make decisions about your life and really, in that case, your life, of course, whatever decisions you have, that ultimately determines your level of success. Now, for me, I guess they convinced me to put my Strava data up here. I am a runner and I like to be out running around. That's why I'm taking all these steps, by the way, because I'm trying to get more activity. I am out doing these things because for me, I like to see what's happening. I collect data, everything from my steps to my elevation to my calories. And I look at this across many different apps, including Tableau, which. That is Tableau up there. And this is how I run my life. My goal is to run an ultra marathon. That's a goal for me. My version of success is actually to get there, but I have to tune all of the data and all of the data that is happening and being pulled inside of these various applications helps me to actually understand what I need to do and what I need to tune. So this is the personal experience, and that's great. But what about companies? Because I think companies also need to be data driven. I'm sure you'd all agree. Now, we believe at Tableau that data is the heartbeat of the modern organization. And that's exciting. What's not exciting, though, is that we studied and interviewed and spoke to roughly 10,000 IT professionals, like people online, like people here in the room, and we found that actually less than 10% of them are getting the full value of their data. That's concerning to me. It's very concerning. And it's really concerning in the world where we are being accelerated with AI, Right? You must go faster. You must keep up. Now, some good news in that survey and that study, and it's actually called the state of Data and analytics report that you can all get your hands on, is that 87% of leaders said they are now these IT professionals accelerating their investment. They are now investing more aggressively in data management and their data priorities to fuel their AI. Strategy, and that's exciting. But of course, nothing's that easy, right? Can't just solve it by buying tools because the journey is complex. It's not easy to go through this data revolution and AI revolution because some of us here maybe are analysts, some of us here may be executives, some of us here may be individual contributors or operational folks. And so we want to be helping you in that regard. Now you may be in different departments, hr, finance, et cetera, or you may be in different industries where there's regulatory compliance, data governance issues, data residency requirements. You may be in financial services, you may be in healthcare. It really is a complex world. And so the most important thing that I can say, and I really mean this, is that we are your guide within the Salesforce and Tableau world. We are your guide, we are your trusted AI and data partner. And that's extremely important to communicate because we are going beyond, we are going beyond seeing and understanding your data because the journey, as I mentioned, is complicated. We will start by helping you connect and of course harmonize your data with of course Tableau data management and Data Prep, but also with amazing tools like Mulesoft, and also with tools and solutions like the Salesforce Data Cloud which connect to third party applications and data warehouses, et cetera, Step one, if you will. And then going beyond that, we will continue to help you see and understand your data. Whether you're using Tableau, whether you're using the Salesforce Intelligent app suite like Revenue Intelligence or of course, right, any allowed there to go to the next step which is taking action with your data. In my personal example, I explained how I'm taking action with my data. Well, you need to take action to be successful. And to be successful, right, you can use some of these new exciting things like Tableau Pulse, which you'll hear about today, or Slack or third party applications. We want to help you across that whole journey. Now what? Actually, in my experience of roughly three and a half months in this role, one of the most exciting things that I get to do is work with our amazing community. And these folks are here to also help you. This is our unique differentiator, right? And yes, let's give them a round of applause again. Because our community is here to help you be successful. These are the individuals who've spent so much time, they are data people. They know how to make a data driven culture work. They have made themselves successful, they have made their company successful and they have made the world more aware of data. And this is incredible. And this is a really great tool and a very unique differentiator to Salesforce and Tableau. So I want to thank them again. And then the other thing I would say as we move forward here is we want to deep dive as we move into this next chapter, which is how do we go from our current environment of focusing on our beloved analyst, but also talk about, of course, the business user, maybe someone like myself or the Salesforce CRM user. And so that I'm incredibly excited to bring up my really good friend and colleague who has nice shoes on, Francois Ajansat. All right.
No, I got my own. Thanks, Ryan. I gotta say, your shoes, pretty stylish. Got good taste. Well, hello everybody. It is so great to be here with all of you to talk about the latest innovations coming to Tableau and how you'll be able to bring data to even more people. Because this is the era of data. We know that companies that use data are just more successful companies than those that don't. And we know that employees who are empowered with data are just more satisfied employees. They're able to get their jobs done better. So the opportunity is truly to bring data to everyone and make every company a data driven company and every person a data person. And this is what we're going to talk about in this session. We're going to talk about how we're bringing data to everyone, empowering every single user. Whether you're a business user or an analyst or a CRM user, everybody should be able to use data to make better decisions faster. And this is key because our mission is to help people see and understand data. And that truly does mean all people. And you'll see in this keynote how we're going to be bringing new experiences for our users with new metrics and insights that makes data easy, approachable and contextual. How are we going to make everyone be able to explore data in an easier way than ever before? And how we're going to deliver analytics in the flow of work so you have smart applications that are actionable. This is what this keynote is all about. And of course, we're going to sprinkle a lot of AI right at the heart of the keynote, because AI is an opportunity. There is no AI without data. And this community is all about data. So we are at the heart of the AI revolution. And by bringing AI into our products, it'll make the product experiences easier to use, because we're going to make the complex, simple. It's going to enable us to bring new experiences that broaden the reach of analytics for more people and Ultimately, it'll enable everyone to be successful with data. This is really the opportunity, and you're going to see it in the new Tableau Pulse. You're going to see it in the new Einstein copilot for Tableau, and you're going to see it across every single one of our applications. This is the beginning of the new generation of Tableau and the new opportunity for everybody to become data powered. And of course, whenever we talk about data and AI, we have to talk about trust. It's important that the AI is trusted and ethical, that your data stays your data and is not used to train other applications, and that we are transparent about how we use your data and how AI is done. And this is key, and it is core to the Einstein platform. All right, as I mentioned, the goal is to reach more people with data and using AI along the way. Now, today, the way most people consume data is by getting dashboards. Everybody getting dashboards today. Do you want more dashboards? Not really. You want more insights, you want more action, you want more empowerment. Now, the opportunity is to simplify the experiences and make data as easy as a Google search, make data as approachable as every single widget you have on your phone. If your business data gets used, that creates opportunity. And we want everybody to use that data. And this is why today we're really excited to share with you our newest application, Tableau Pulse. Tableau Pulse is a whole new experience for data that's powered by generative AI. It's personalized for every single user, contextual to the task at hand. And it is smart. It enables you to pull out insights from your data automatically. So you guys want to see it?
Yep.
All right, Homer, are you ready to show it?
Absolutely.
All right, please welcome Homer Wang.
All right, thank you, Francois, and hello, Dreamforce. I'm Homer, a product manager here building Tableau Pulse and Tableau AI for all of you. Now, I hope you're just as thrilled as I am to show you how we're reimagining the way anyone interacts with data. So demo hats on, and let's dive right in. Like many of you, I start my day in Slack with Pulse. I can get a personalized digest on the key metrics that I follow and matter most to me. Now, AI looks at what's happening across the board and delivers a crisp summary upfront so that I know what to focus on. In just two seconds. Here, I see an unusual uptick in device sales. Well, as a regional sales manager, this is great news, but I do need to understand a little more than that. So let's click in.
Here.
On the metric detail page, I can clearly see this latest anomaly picked up by Tableau and visually explained to me. I can also explore metadata on the metric that our analyst friends helped define so that I can trust what I'm seeing. If I want, I can filter this view to my own liking while respecting my security context. Now that I know what I'm looking at, what about the why? Well, guided questions just by AI help me phrase what I want to ask but don't necessarily know how. And here I'm interested to know which products drove the sudden increase. And with one click I get a plain natural language insight accompanied by visualization. All coming from Tableau. Now this insight here shows me the top drivers behind this change. E phones and Samsung phones. Well, like Ryan said earlier, these smart devices, they're all the buzz these days. And of course, we all have our own questions too. Now, in this case, I'm wondering if we'll fulfill these orders. So I can simply start by typing in Pulse, where smart and contextual recommendations come up at every step by step with the help of AI. And there you have it. Another metric, another insight, all answering my questions at the speed of thought. Now what's happening behind the scenes is Pulse detects business critical insights such as drivers, trend forecasts and outliers, all with trusted statistical calculations from Tableau, where AI can make the language more consumable and deliver them to you proactively so the all of us can see and understand data. But it doesn't stop there. What if I want to stay on top of these changes and share my findings? Well, in just two clicks here, my entire team now is following inventory fill rate so that they can start tracking and acting on it too. And just to confirm that, I can back out to my personal homepage where I'll be able to see inventory fill rate alongside other metrics that I care about. The best part is Pulse isn't just limited to Tableau, it's everywhere. You and your teams work today like an email where you can receive a daily dose of your metrics. Let's ask April for my team here.
Did you get it?
Yep.
Awesome.
On your phone where you can receive insights on the go. I am scrolling through them right now. And of course in Slack, as you saw earlier, we get to collaborate more easily. But here at Dreamforce, we all care about Salesforce, don't we?
Mm, you guessed it.
I land in Salesforce and find the Pulse homepage deeply embedded with all my Favorite metrics in one place. Clicking into the metric here, I see the same detail view with the same interactions that we've seen. Okay, hats off. Let's rewind. We trust it, we're familiar with it. It's quick to find and easy to use. Now all of us can truly succeed from anywhere. This is Tableau Pulse metrics and insights reimagined by Powered by Tableau AI to enhance and accelerate everyone, to make informed decisions fast, and to take actions on data. Thanks for staying with me and pass it back to you, Francois.
All right.
Great job, Homer. I love Pulse. I use it now every day, and it's really made my daily experience easier. I get all of the information at a glance, and I can take action on it really, really quickly. But, you know, when you want to explore data, this is really where the tableau superpowers come in. Tableau is easy to use. You can easily slice and dice your data however way you want. But normally when you start in Tableau, you got a blank screen and some data, and you have to kind of learn the product. You have to know how to drag and drop where the features are. You need a visionary around you. You need the documentation, you need experts, you to help you get successful. But what if we brought AI into the experience? What if you had Einstein with you that understood tableau could help you answer your questions more easily? Well, the future of Tableau is to have AI embedded in the exploration experience, where AI fully understands how to use the product, where AI understands the meaning of your questions and can help essentially do the drag and drop for you. So it's not about either or, it's an and it's augmenting the experience, making it 10 to 100 times easier and making all of you more productive. That is the goal. And so today, I'm pleased to announce the Einstein copilot for Tableau. Oh, yes. The Einstein copilot is really gonna be a core part of the tableau experience that enables you to ask questions of your data, and it'll basically explore it for you. It'll give you better results because it understands a lot of the context. You'll have better best practices built in, and ultimately, you'll just be more successful. You'll be able to ask more questions and drive more value to your organization, or you can just put your feet back up and enjoy the rest of your day. So let's see Einstein Copilot in action. So for that, please welcome Hanto Ming Hanto.
Thanks, Francois. In the next four minutes, I'm going To show you how Einstein Copilot, backed by the Einstein Trust layer, can speed up and improve the quality of your data analysis. Here in Tableau Prep, I have customer purchase data for a nationwide chain of pet supply storage. I want to use this data to create personalized experiences for my customers that'll drive incremental revenue. To do so, I need to know where my customers are, so I need their postal codes. Unfortunately, my postal codes are trapped in this customer mailing address column. Normally, I'd have to figure out how to write a calculation to extract this, but with Einstein, all I need to do is ask in natural language. And on the fly, Einstein is able to create this calculation for us. Now all I need to do is give it a name and voila, a new column in my data with the customer postal code. And I did all of this in a matter of seconds and without writing one line of calculation code. So with Einstein, you and anybody can use Tableau Prep to transform the data they need into the format they want. So how are we going to reach these customers, though? Well, did you know that you can use Tableau to visually explore your audience data and to create audience segments in Data Cloud?
Oh.
We'Re good. Okay, there we are. A little excitement there. So I have just connected with the help of my friends back there, to Data Cloud. Now, when I'm presented with a blank slate like this, I ask myself, where the heck do I begin? But Einstein has got you covered. Using generative AI and statistical analysis, Einstein is able to understand the context of your data. And in doing so, Einstein is able to suggest relevant business questions to kickstart your analysis. Let's take a look at this one about patterns of my sales over different product categories. Look, with one click and without having to drag a single pill onto a shelf, I'm able to see the viz that shows my sales for all my different product categories. But what about this pattern Einstein was looking at? I can see? Yeah, that's right. Outdoor sporting goods are popular in the summertime. That's not a surprise. But that gives me an idea. I know that our in store experiences drive bigger purchases compared to online. What if we invite these outdoorsy and sporty people back into a store with an event like an outdoor pet first aid class? Well, how am I going to do that? First of all, we're going to use those postal codes we extracted earlier. And you guessed it, we're going to ask Einstein. Show me the location of customers who bought sporting goods in the last three months by zip code. All right, I See all my customers on a map. All right, but what about my stores? How far are these customers from store locations? And look, without knowing anything about map layers or geographic roles in Tableau, I was able to create this intuitive yet complex MapViz with Einstein. But don't forget, Tableau, at its heart is an interactive and visual tool. I can easily grab these customers from San Francisco and with our integration with Salesforce, send these customers up as a audience segment. And. And I did all of this without leaving Tableau. Now I can't get to the screen. Oh, sorry, my bad. And now my marketing team has all the information they need to activate the segment and send custom communications. Like this. There we go. Like this. To all my customers. And yes, I did manage. And maybe this is why we didn't have a good demo. I managed to sneak my dog into the keynote presentation. All right, now, in summary, Einstein Copilot, backed by the Einstein Trust layer, will let anybody who can ask a question visually explore their data in Tableau. And with our deep integrations into data cloud, you can get the insights you need to connect with your customers faster. Back to you, Francois.
Awesome. Great job, Honto. I gotta say, any demo that includes a dog photo is a fantastic, fantastic demo. That's the simple demo rules. You know, with the Einstein Copilot, you basically have an expert with you at all times to help you get to the answers faster. It is powerful, but we want to go further. We want to infuse data and AI everywhere. You know, today when you think about your business applications, well, they're your business applications. If you want to get answers from those, you go somewhere else and you have that typical swivel chair problem. You lose context, you lose the data. It's just frustrating for the users. Well, who wants a dumb CRM or a dumb application? You want smarts built in. You want insights right where you do your work. And this is what we're trying to do with our brand new intelligent applications for Salesforce. These are pre built applications and available out of the box that you can use to deliver insights right in the flow of work. So whether you're using service cloud or revenue cloud, you have insights automatically there for you. It's easier to get going. You just deploy them and boom, you've got value automatically. It's contextual to the job you have at hand. The insights, the dashboards, the KPIs are built for the task that you have. And of course, it leverages the complete power of the platform. From CRM analytics to Tableau to Data Cloud this is the full power of Salesforce coming together in these rich applications. So to show our next applications, please welcome Srivi Agandeshawan to the stage.
Srivi thank you Francois. Hello Dreamforce. As Engineering Leader for Intelligent Applications, I'm super thrilled to be showing you today what my team has built. Tailored experiences helps everyone achieve their work faster by streamlining data with Service Intelligence you get key insights to effectively run your service operations out of the box. Pre built dashboards enable you three key insights for service comprehensive case views, Omnichannel and Conversation mining. So let's jump in with Omnichannel View Routing cases is easier than ever. Leaders can track their volumes of work by cases and channels to reduce costs and improve service operations behind the scenes. All of these data sources from various channels, conversation data, Omnichannel data, service data and third party are all harmonized and powered by Data Cloud. Some of the most valuable data we have about service operations is the millions of hours agents spent on call every day with our customers. What if we use AI to unlock the data? Service Intelligence now brings in Einstein Conversation Mining which is which mines all the customer interactions integrated, identify the top reasons and key drivers and highlights it in a trusted and secured way. As you can see here, customers are having lot of questions about their invoice. With these insights, service leaders can identify and focus on the areas that they may not otherwise be aware of. With cases, Dashboard leaders get a comprehensive view of their team's work on high level stats such as total escalated cases CSAT by channel as you can see here in the monthly trend, our incoming cases have been spiking up new. Normally we would need to spend time analyzing this, but now with one click I can ask Einstein. Service Intelligence brings me the power of generative AI guiding me through intelligent prompts to understand the key factors that are driving my case escalation. As you can see here, it indicates that cases reason being billing as a topmost reason for the escalation. So let me explore this data more deeply. Right from here I can explore into tableau. Service Intelligence brings the power of Salesforce Data Cloud and Tableau visual exploration analytics right for you. As you can see here, I have maintained the data context and connected to the same insights without any additional effort. Now let me drill into the data more deeply. I can pull up a quick sheet in tableau and did you see that I don't have to connect to the data again, I have it right here from Service Intelligence. So within few clicks I want to understand how my cases are Geographically distributed across in the U.S. as you can see here, Oregon and Marina are having the higher spots. Let me get this insight back to my team right from Tableau. I can publish to Salesforce within few clicks. All of my insights are natively available for me. I can drill into the same filter context in the service workflow. There you have it. Service intelligence breaks the data silos brings analytics to every Salesforce users in their flow of work. Supercharging data with AI in the world's best CRM. Back to you Francois.
Great job Srivi. So this is how we're bringing analytics to everyone, to every single user, to every single company, to every single application. Because really the opportunity is to have analytics without limits, analytics without constraints, where AI is built in and provides a new superpower and supercharges every experience, every user and makes everyone successful. In talking about being successful, it's time to talk about our customers and how our customers are able to use data to to do more. So for that I'd like to welcome Emacs. Come on up Elizabeth.
Thank you Francois. Hello everybody and thank you for being here today. Now, as we've mentioned, data is for everybody. You might even say that data is a team sport. And speaking of sports, I am a huge baseball fanatic. I played softball my entire life, as you see by my adorable Q photo here. And when Growing up in Michigan is a way to stay connected back to my family. When we moved to California, I participated in three fantasy baseball leagues with my cousins, my high school buddies and my college friends. Now imagine all of that data that was available to me back then through tools and online. I wish that I had tableau to help me and that's why I am so excited to share this inspiring story of of the Texas Rangers. They are an organization that has truly transformed their company with data both on and off the field. Let's go ahead and take a look.
My favorite thing about going to Globe.
Life Field is just the entire experience.
You are going there to watch a baseball game, but they give you so much more.
Fan loyalty and passion is what makes the wheels turn at the Texas Rangers. Fans were the reason that we decided to move from Choctaw Stadium and build this beautiful ballpark in Globe Life Field. We have a roof now and in Texas that's pretty important. We were all ready to have this great big party and welcome all of our wonderful fans and then the world shut down. There was hardly any revenue rolling through.
Any sports organizations at that time.
So we had the challenge of not only bringing back Fans post pandemic, but also filling up an entirely new ballpark.
Just the amount of data that we have now can be a little overwhelming, actually.
Ticket sales, merchandise concessions. It's almost a challenge to know what to do with all that data.
Tableau is really what allowed us to start tying all of the siloed data sources together. Now we are this force to be reckoned with when the fan comes here because we know what they want and what they need.
Tableau has really allowed us to make smarter decisions in real time. We're not acting as the gatekeepers anymore. We're able to spread that data love throughout our whole organization.
When someone looks at a dashboard and that light bulb goes off, that's what gets me excited. That I can create something that is making someone else's job easier or puts an efficiency in place in our business. Tableau allows us to change prices at the drop of a hat, allows us to better understand the fans who are going to be attending specific games and create ticket offers that cater to them. That ultimately leads to revenue generation.
For the Texas Rangers, we saw an over 2000% increase in some of our revenue sources. By being more intelligent with how we target our fans. Adding AI to that equation of CRM plus data is really a grand slam cost combination for us.
We want to know what we don't know. The questions that we might not even think to ask. AI allows us to find additional insights that we never would have looked for.
Customer360 really means getting that full understanding of our fans. Trust is incredibly important when it comes to tools like AI. We want our fans to trust us with their data.
Our relationship with Salesforce has really allowed us to to become dreamers in the data space. We want our fans to feel like they are part of our team, that they are part of our family.
We really want to deliver those magical moments that start kids as Rangers fans and grow them into Rangers fans for life.
Please join me in welcome to the the stage director of Business Intelligence, the Texas Rangers, Michelle Null. Hi.
Welcome.
Thank you so much, Michelle, for being here today.
Thank you for this opportunity.
We have been spending a lot of time together. Yes. And I am blown away by all your uses of data and you're a very small team of three. But you've been with the Rangers for 18 seasons. Data did not look the same back then. Tell us about some efficiencies that you've had since your very first Tableau dashboard.
No, we started with tableau about 10 years ago and at the time all we had was like Ticket sales data, we had some gate scans, we had retail data, we had some marketing data in an Excel spreadsheet because isn't that where all data starts in Excel? So from there we've taken, took what we had and we built a couple of ticket sales dashboards which actually we are still using today. They're not broke, right? They work. But in addition to that, we've expanded on our analytics for more dashboards. We are doing deeper dives into our marketing metrics. We're doing stuff with guest services and fan relations. We have operational, real time operational reports, parking gate scans, concessions in retail, all of that kind of stuff. Baseball and data are kind of synonymous, right? Everybody knows that there's a lot of data in baseball, but we're just a business. We're a business like anything else. And there's just so much data out there. Data is everywhere. But taking and knowing what is important and relative to you is the challenge.
So that you just covered everything on your back of house. Let's shift to front of house, which is your fan experience. What does that look like both on game days and non game days.
So on a game day, and you saw part of that in the video, there's our operations center and it takes, you know, starts, parking, heat maps and that how that relates to gate scans. And then if we have a giveaway, we're analyzing and we're looking at how many giveaway items that we're giving out so that it's fair across the ballpark, real time. With our concessions and our retail, we know what our top items are that we're selling. And believe it or not, we actually even have sensors on our bathroom supplies.
Well, and one thing you mentioned with concessions, which I obviously know you track, are your hot dog sales. So why don't you tell everyone a quick funny story about how you actually share tableau data for dollar hot dog Wednesdays.
Yeah. So this whole hot dog thing is just so crazy to me. I heard our announcers about two years ago talking about I wonder how many dollar hot dogs we sell. And I was like, well, if I want to know, they just, we have the data, they just have to ask. So then I was curious so I went back and just for fun built this dashboard and I had hot dog like icons and everything all over it. It's like, oh, this is this fun. Fast forward about a year and my boss, Katie, she's sitting in a meeting and they're talking about how to further enhance the fan experience and doing more hot dog stuff up on our Video board. And Katie's like, well, as a matter of fact, we have a dashboard for that. So it's a lot of the data that we have is it enables or enhances the fan experience, where this is really the only piece that is fully fan facing. And that number is real, folks. That number that you see up on the video board is real time. And the number of dollar hot dogs, I love that.
Okay, so I don't know if the audience caught this, but you are only a team of three. You're sitting on more data than you know what to do with. Last night you were telling me you have data on servers you've never even explored yet. So what does that look like for the future? And now we're all entering into this AI revolution. You have a lot to think about. So what does that look like for you?
So I'm very excited about Tableau Pulse because the ability to take more data and have deeper insights. Yeah, please sign me up, please. Because we just don't have the bandwidth right now to be able to service everything. And recently we had an event and I was up in our operation, that operational room, watching our EVP of venue operations. Look at those dashboards and see the heat map of the parking and then the gates and our security cameras. And I'm sure he could make better use of his time than sitting there watching maps fill up. So if he could have those insights delivered to him and not have to think about it with even more data and not just those couple of things that we're delivering right now, it's going to be glorious. I can't wait.
That's awesome. Well, you know, I could talk to you for about this for hours.
I know.
And all of you can learn more from Michelle and her team. They have a breakout session tomorrow at 11 o'. Clock, so. So please check out and learn more about how the Texas Rangers are transforming your organization with data.
Thank you. Just one quick thing before we go. I know this is a surprise for you, but I know that you said that you're a baseball fan and so hopefully now that you're a big Rangers fan, so we wanted to give you a Rangers baseball signed by the team. Oh, I love this. But don't get excited. It's not the team team. It's actually the business analytics team.
Oh my God.
Thank you.
I love that.
Thank you so much.
Michelle and I have become fast friends in the last month, so now I'm glad I am a Rangers fan. Now. Tableau also has fans and that is our data fam. So to introduce you to them, I'd love to bring up to the stage VP of Community, Larissa Amoroso.
I'm jealous. The Tableau community, also known as the Datafam, is a global network of more than 3 million people who push the boundaries of our products, champion data culture, and help people everywhere see and understand their data. But rather than just talk about the incredible datafam, I thought I would try something a little different and show you. Here at Tableau, we're always experimenting with new and exciting ways to explore our data. Like with tableau gestures, which allows you to present any data on any computer, with any webcam. Let's say you want to join the Tableau community. Our biggest community is here in the United States.
But.
But what about the rest of the world? We can clearly see the top 25 countries listed at the bottom, ranked by number of community leaders. Tableau visionaries, ambassadors and user group leaders around the world are hosting local meetups, leading visualization challenges, and answering tough data questions to help you, no matter where you are, on your analytics journey. That's right. We have community leaders all over the world ready to welcome you now. I could play with that all day, but I am so excited because today we have a very special guest tuning in. Live from his home in the uk, Tableau visionary Tim Nuena, also known as Tableau Tim. He is.
Hi there, fam.
You almost need no introduction. Also known as Tableau Tim, he is an analytics consultant and instructor and he's a YouTube sensation with more than 55,000 subscribers and more than 2.8 million views on his analytics tutorials. So with all of his efforts, he is helping people everywhere grow their data skills. Tim, thank you so much for joining us today.
Absolutely, A pleasure.
You have so many accomplishments. How did you get from your very first viz to where you are now in your career?
So it started out in student analytics. I was looking at student data at the University of York where I studied, and I ended up going to another opportunity to work in marketing and communications and the data there just sort of pulled me in. The problem I had though is that the stories that were coming from that data weren't as compelling. A lot of the social media data at the time just measured likes and and these sort of basic metrics. And so I ended up finding a route into analytics. And when I started to work with data, I started to realize that businesses were super passionate about their data. But the moment it clicked was when I started learning looking at quantified self data. That's the Kind of data. Ryan was talking about data from Strava last FM and so on and so forth. And it's only then I realized that the passion I had for my own data was the passion that businesses had for their data. And so I started to spot some common themes that people were struggling with as they were working with their data. And I thought I'd start to make a visual way of sort of helping them understand those problems and get past them. So that's how it started. And then here we are today.
Such a story journey. Now, many people here are still just getting started on their analytics journey, and it's a little bit of a different landscape today. What has you most excited as you think about Tableau and this new AI revolution?
I think AI has this incredible opportunity to amplify people who are already exceptionally skilled, sort of raise their skills up to the ceiling. But also for people who are struggling to get into these topics or struggling to pick up these skills, it actually has an ability to lower the barriers, almost help them get into these topics. And so it can simplify the entry points for a particular topic. We saw Hunter do a nice demo there. But also I think it's got this ability to help people with their skills. It kind of brings them into a topic so they can understand what to Google, what to search, and then how to build on those skills.
Now, with your platform, you're bringing data skills to so many people. What is something that you can share with us about teaching and giving back?
It's a super interesting cycle. I think one of the things that I always tell people is that when I make videos, I learn a lot more about the topic than I would have done if I just went to learn about the topic. So teaching kind of makes you understand the topic to another level. And when you put that content out there into the community, you get sort of responses, people ask you more questions. And actually those questions are the best questions to answer because they enhance your understanding. So it's this sort of nice feedback loop that just sort of happens. And what is nice about that is that, you know, I got my sort of break in data through the Datafam and it's just been really special to sort of give it back as well. So hopefully that cycle continues and we keep building the datafam.
Well, speaking of giving back, you have done so much for Tableau and for the Datafam. Before I let you go, I have one more thing I'd like to share. It's a golden hoodie and we have one in the Mail on its way to you now. Tim.
Amazing.
You truly embody what it means to be a tableau community leader and a visionary. Thank you so much for everything that you've done. Congratulations again and thank you so much for joining us today. Let's give him a round of applause.
Thank you.
Wow. What a magical moment. I wish he would have been here, but this was fun, too. Back in 2022, we made a pledge to all of you to bring more foundational skills to everyone. I am so proud to say that we are on our way to enabling 10 million people by 2027. We hope you'll join us on this journey. And with that, I'm going to hand it back over to Ryan.
Thank you. Great job. So I want to say thank you. I know we've gone a little bit over, but I also want to remind you, we are your guide here at Tableau and Salesforce on your data journey. There's a lot to learn out there and I want to make sure that you also know clearly when we talk about data for everyone. We've covered the business user, we've covered the analysts and the Salesforce CRM user. Please check us out. We're out here. We've got Tableau conference also coming up in San Diego at the end of April. So excited about that. Got lots of opportunity to go over and check out, do more with Tableau out there in the. In the Expo. And of course, just come and see us if you have questions and I will leave it at that. Thank you so much and have a wonderful Dreamforce.