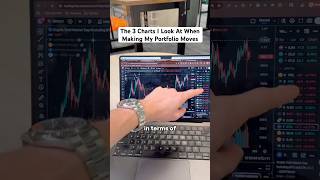
Ben Simpson (YouTube) explains the three primary charts he monitors for crypto investing: bitcoin dominance (percent of total market cap in BTC), total crypto market cap excluding Bitcoin and Ethereum (used to gauge altcoin capital), and the ETH/BTC pair (Ethereum vs Bitcoin relative performance). He interprets recent history (notably 2021) to argue that altcoin capital has not returned to all-time highs and uses these charts alongside fundamentals and on-chain data to form short- to medium-term market views.
Chapters
I've been able to make seven figures in crypto and I want to share with you the three main charts I look at whenever I look at investing. The first one, which is the most basic is bitcoin dominance. This bitcoin dominance chart essentially showcases us the amount of percent of the entire crypto market cap that is in bitcoin. The lower this chart, the less bitcoin and the higher altcoins are and the higher the shark goes, the less capital in altcoins that flows on to the total three. So the total three is the total crypto market cap excluding Bitcoin and Ethereum. This basically gives us an indicator of how much capital is is in altcoins. As you can see here, going right back to 2021, we haven't yet really broken out of all time highs in terms of the amount of capital in altcoins. This tells me that the altcoin market and the bitcoin dominance showcases that we're not really anywhere near an altcoin rally just yet. The other one is the ETHBTC chart. The ETHBTC chart shows us the outperformance of Ethereum versus Bitcoin. On the way down, this chart shows us that bitcoin has been outperforming. And on the way up it shows us that Ethereum outperforms and usually altcoins do as well. So the big altcoin run we had back in 2021, we had a huge rally up. This is where all the altcoins were outperforming. We had a small rally here early this year, but now we've sort of started to peter off as well. These charts just give us a good indication where the market's at and what direction we're heading in. Generally. I use a lot of other indicators on top of this to give me a good insight, but these are the three main charts I utilize then then overlay my insights on fundamentals and on chain to give me an understanding of where we are going in the next few months and into the coming years.