Trading System Profit-Potential
A breakdown of how to evaluate a trading system's profit potential using reward-to-risk ratio, drawdown, winning and losing streaks, and average return per trade. Learn which metrics matter most for maintaining discipline in your strategy.
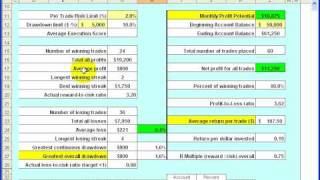
Okay, this is really cool. This is where you can take a trading system, whether it's yours or one you're considering, and you can see what the profit potential is for that trading system without risking any money in the markets at all. And it's just really cool and it gives you the profit potential in dollars. This is hard numbers. This is not claims. This is with actual market data. This is really cool. This is so easy to use and the information is so powerful. All right, let's just jump right into it as far as using this. This is wonderful. All you've got to do is come in here, you put in whatever your system ID is, your trading system. The reason I say profit was per trade, what your longest winning streak was, your best winning streak, how much you made, and this right here, the actual reward to risk ratio is also key. A lot of traders, they think or their intention is to be trading with the 3 to 1 reward to risk ratio. This tells you what it actually is. So again, just getting expectations in alignment with reality, you know what your expectation is. This is going to tell you what you are actually making for your risk on the winners and with the losing trades. In the data that I've entered here below, there are 36 losing trades total. All losses was 79.508 average loss. Also, again, very important to know, and this right here will be green. So long as it stays within your per trade risk limit. It goes red if your average trade is exceeding that. Very important information to know. The longest losing streak, and that's losers in a row, a streak, and how much you lost during that losing streak. And again, in terms of your percent of account, the greatest overall drawdown. Extremely important to know when you're looking at your system or any other, when you don't know the drawdown that can be expected with a system and you hit a series of losing trades or you experience a drawdown. This is where a lot of traders really get messed up because their confidence gets shaken. The temptation to start chasing money, it's like, oh man, I got another loser. And now you want to start playing with the system or entering trades that are questionable or maybe you're not planning them properly because the losses are hurting, the drawdown is hurting. That's when discipline usually often goes out the door. And that's really what's hurting traders because you want to be able to make it through the drawdown and get back to where the winning trades are coming back. Knowing this overall drawdown, it all is within your comfort zones. If you take Test your system and you find out that the greatest overall drawdown, let's say, is $10,000. Well, if you can't stomach $10,000 or if it's just really going to stress you out, you're going to have a heck of a time with your discipline and it's only going to make matters worse. But if you know that you can expect this and your system is still going to be profitable after all at the end of the month, then it makes it a whole lot easier to stick to your system. Now this right here is also another key metric, actual loss to risk ratio. And that's comparing the actual losses versus what you were risking. So long as this is less than 1, that means that you're keeping your losses within your intended risk on average. Again, you just put in your net profit and loss for each of the trades as you're doing the back testing. Now, this is where it gets really cool. All this information here is extremely powerful. It looks at the winning trades, the losing trades, and then your trading overall. Where this is cool is you can see what the number of winning trades was, total profits for all the trades, what the average profit was per trade, what your longest winning streak was, your best winning streak, how much you made. This right here, the actual reward to risk ratio is also key. A lot of traders, they think, think or their intention is to be trading with the 3 to 1 reward to risk ratio. This tells you what it actually is. So again, just getting expectations in alignment with reality, you know what your expectation is. This is going to tell you what you are actually making for your risk on the winners and with the losing trades. In the data that I've entered here below, there are 36 losing trades. Total of all losses was 79.50. The average loss. Also, again, very important to know. And this right here will be green. So long as it stays within your per trade risk limit. It goes red if your average trade is exceeding that. Very important information to know the longest losing streak, and that's losers in a row, a streak, and how much you lost during that losing streak. And again in terms of percent of account, the greatest overall drawdown. Extremely important to know when you're looking at your system or any other. When you don't know the drawdown that can be expected with a system and you hit a series of losing trades or you experience a drawdown. This is where a lot of traders really get messed up because their confidence gets shaken. The temptation to start chasing money, it's like, oh man, I got another loser. Now you want to start playing with the system or entering trades that are quite questionable, or maybe you're not planning them properly because you just get the losses are hurting, the drawdown is hurting, and that's when discipline usually often goes out the door. And that's really what's hurting traders, because you want to be able to make it through the drawdown and get back to where the winning trades are coming back. Knowing this overall drawdown, it all is within your comfort zones. If you test your system and you find out that the greatest overall drawdown, let's say, is $10,000, well, if you can't stomach $10,000 or if it's just really going to stress you out, you're going to have a heck of a time with your discipline and it's only going to make matters worse. But if you know that you can expect this and your system is still going to be profitable after all at the end of the month, then it makes it a whole lot easier to stick to your system. Now this right here is also another key metric, actual loss to risk ratio. And that's comparing the actual losses versus what you were risking. So long as this is less than 1, that means that you're keeping your losses within your intended risk on average. Again, that's a crucial one. That's the winners and losers. Over here is where it really gets good. Out of this time period, we had 60 trades total trades placed. Net profit for all those trades was 11,250. Now here's another one where it can get really rough emotionally to stick to a system or to have faith in it when you don't know what the winning percentage is and the profit to loss ratio. Now don't look at either of these individually. They go hand in hand. Here's what I'm talking about. Say you've got a system where you get a system and the percentage winning trades is 80%. Oh yeah, sounds great. Well, no, not necessarily. Because if the profit to loss ratio isn't enough to have you profitable, where your average return per trade is netting you a decent amount, the 80% really doesn't mean much. If the 20% losers are wiping out or wiping out all your profits, that doesn't matter. So these two go hand in hand and this is where you wind up. A key metric is your average return per trade or your average profit or loss per trade over all these 60 trades. This is how much you're going to make or lose on average for every trade you place. All winners and losers combined. Knowing this Number. This is a key metric. Not just the percentage of winning trades, not just the profit to loss ratio, but the average return per trade. Huge, huge plus. Just from a confidence standpoint, if hesitation is part of your challenges right now, knowing what your average return per trade is extremely helpful because this is what your average profit or loss over all trades. And if you know that this is a decent number, it makes it a whole lot easier to go ahead and enter those trades instead of hesitating and then watching the opportunities pass you on by and that whole problem. Now these two fields down here are also pretty important, not crucial though. This return per dollar invested. This one is mostly for stock traders, option traders, whoever wants to take a look at the outlay. Whether your capital requirements are high and you want to see what your, your net return per dollar invested is. That's pertaining to this outlay column. For every dollar that you're having to invest, you're getting 19 cents back. This one right here, this R Multiple reward of risk overall. This is looking at what your overall reward for dollars risk is. So that's looking at this column and this is overall trades. This section here is overall trades. But anyway, one of the coolest things about this is if you trade it over a certain time period, it's not likely to be exactly one month. So this number is not going to pertain to exactly one month. The whole thing here is we want to know what the profit potential is on a monthly basis. This field right here takes this and normalizes it to one month. This is the monthly profit potential for this system in these conditions based on data from this time period. And this. And that is extremely cool. Now you can sit there and look at your system or like I said, if you're considering buying a system, trying a system, whatever. This right here tells you what the monthly profit potential is if you stick to the system and you trade it. Well, this is the profit potential. We've got a couple other tabs to take a look at. Let's go ahead and move on to the next tab. SA.