Wyckoff and Volume Trading Specialist – Tim Ord – Episode 069
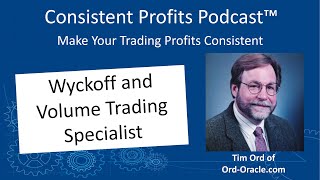
Tim Ord, a veteran trader, explains volume and Wyckoff method analysis. He covers panic buying and selling patterns, his market letter, and what new traders should know about technical analysis.
Hello and welcome to the Consistent Profits podcast brought to you by Inside out trading and Brian McAvoy, where the focus is on consistency, because when you have the consistent part down, profits become easy. Hello, everybody. This is Brian McAvoy with Inside Out Trading. And welcome to the Consistent Profits podcast. Today I'm really excited to be interviewing Tim Ord of the Ord Oracle. He's been around for a while, been trading since the 90s, and it's got some unique perspectives that we're going to explore today. Tim, thanks for taking time out of your day to do this with us today.
Thank you. I'm glad to be here. So it'll be fun.
Yeah, indeed. So you got started in the early 90s. That's when I got my start too. I mean, for me, it was Ken Roberts mailer campaign that drew me in and I got started at futures. How'd you get started with trading?
Actually, I started back in. I was a stockbroker 1977, as my first year was Dean Witter and the big three brokerage firms back then, they're all defunct now, but was Dean Witter, Merle lynch and E.F. hutton. I worked for Dean Witter. And so I kind of. I had a bad math degree from the University of Nebraska, so technical analysis always was my forte. I guess it made sense to me. But back in the 70s and even actually part of the 80s, technical analysis kind of looked on badly, I guess you might say, because everybody back then was fundamentalist. So. But anyhow, that's. I've been in the business since and I got interested in technical analysis through Stan Weinstein. He was one of the original tech analysis guys. So I took his market letter and kind of started off from there. And that was basically mid-80s, but at that still time I was still a stockbroker until late 80s, but that was kind of my start. I guess so. But my market layer never started until like 1990. So I've been in it a while. So.
Yeah, well, and things, things were a lot different back then. I mean, you figure out back in the 80s, I mean, that was when, you know, calculators were still new. PCs weren't even, they weren't even a thing back then.
Yeah. Oh no, you did. You bought graph paper and drawn your own charts. You know, starting out in the 70s, it got a little bit modernized after that. But yeah, it was a struggle to, to get charting back then. So.
Yeah. But well, so as far as your technical analysis, so what were you, what kind of methodologies were you. Were you employing Back then.
It'S actually there's. There was a GAN method that didn't work really well. Elliott Wave was kind of popular back then. I forget the guy's name but you know, Elliott Wave was big. That didn't really work well. Then he started doing moving averages that worked better. So it was all kind of low tech and it was kind of like a. Back then was kind of that people thought it was more as voodoo. It was actually rather than a science. So. But it evolved and now it's, it's quite in depth. You know the stuff you were doing now compared to then it's. Oh yeah, that was, you know, I had to start somewhere I guess. So we started pretty much at the bottom of everything.
Oh yeah. Well you're just give everybody another reference as far as the, the state of technology. I remember back in the 70s long distance calls were a thing back then. I mean that was a topic of conversation and being able to make a long distance call without a costing you a hundred bucks and having a good clear call, that was a big thing got sorted out.
Oh yeah, it was then you had modems, you know that started off in boat is the mid-80s. You know, you got your information from modems. You had to dial up a phone and you had wait for this weird sound to connect. And the process was slow and tedious, a lot of drop lines. It was kind of prehistoric I guess compared to nowadays. You know it's, it's, it's, it's, it's, it's advanced a lot. But those were struggles trying to get the information currently because you know if you went through a modem you waited and waited and the information would gradually show up. And so you had to be really forthcoming if you wanted to get into technical analysis, information downloads because he had to wait for it. It was, it was a struggle but.
Well, but, but you made it work. So how long did it take you to actually kind of get a handle on trading and get it working?
That, that took quite a few years is. It was like everything you kind of. You start off, you know, you don't bet your life savings on it but you know you get blown up a couple of times along the way and those are the best times to figure out what, what you did wrong, what you did right. And most starting out I did mostly wrong. So. But as. And I read a bunch of books. A lot of these books got me in the wrong direction because there, there just weren't a lot of good information back then, you know, compared now. I think It's a lot better. But you know, but they, they took you on different paths, you know, paths worked out fairly well. Other paths didn't work out at all. But.
Well, let me, let me catch it before you get too far off the topic just because you brought it up. It's a little different, different thing. Don't everybody talks about stuff that they love and all the, you know, the great stuff and everything. I don't hear very often somebody will say, well, you know, you know, ran across this and it didn't work out, work out that great. So as far as books that you read back then, what were, were there any of the like, more famous books that you kind of found weren't quite up to the reputation or anything?
Well, I can tell you the ones actually started to get me on the right track was Counseling Charting. I think it was Steve Neeson's book as Counseling Charting. And that seemed to improve a lot from bar charting. Then I got into volume and that's the weiss cough method that actually got more on track of doing things right. Then I actually wrote a book on volume secret giants price and volume. And so I kind of took that weiss cough method to another level and you know, it fine tuned quite a few different things that helped me out.
So, so, so that we can help out to the people that haven't heard of the Wyckoff method and volume trading. It kind of give, give everybody a brief kind of overview what, what it's about and how it's different from some of the other kind of more traditional, so to speak, methods.
Well, actually volume, basically a high volume. In other words, what you want to have, if you're doing a bar chart or counseling chart or some sort of a chart, you want volume higher on the upswings than you do on the downswings and that shows there's price energy to the upside. And actually I do have a software program that I've sold in the past and it's still out there. Matter of fact, you can Google ord volume and you'll find some examples about it, but it measures the average daily volume on an upswing or a compared to the downswing. As long as a higher volume on average is on the upswing compared to the downswings, the market's in an uptrend and vice versa to downtrend. The volume will start to increase on the downswings compared to the upswings. And that's how you, you define which way the direction of that particular issue is going. Just by measuring the volumes of the upswing compared to the downswings. So that's, I've learned that throughout the years. But you know, there's another thing too. You know, when they have panic. I always brought this up to. Panic is another topic that really kind of honed in on over the last, actually 20 some years. I really kind of discovered it just by like everybody else does, when there's panic in the market, everybody exit, exit the exit the trade, whatever. Well, those are huge opportunities to step into a trade. And I've done a lot of work over the years on panic. Panic only happens in one, one area and it always comes at bottoms. If you don't have panic, you don't have a bottom. So if the market's going down, there's no panic. That market's going to continue down until it does get panic. And panic is basically big downswings with big volume. If you start seeing that, you're seeing panic and that's an opportunity. And how long panic can last? Usually panic lasts a very short period of time compared to tops. Tops can take weeks, months, you know, sometimes even years. But most times weeks or months, Tom bottoms happen in a day or two or three. It just totally blows out to the downside. So you got a very small window to buy into that panic. And, but if you look at all bottoms, you'll see a big spike in volume. And that's, you know, it's panic. And that's an opportunity not to sell, but actually to buy. So but if the market goes down gradually and the volume's fairly consistent as it goes down, that's usually not a, that's you're not showing panics. Panic is, is when volume increases like at least 50%, if not a hundred percent compared to the previous days. If you see that big jump in volume, you know the, the panic is occurring. I can talk a little bit about the trend too, but a lot of people may not know about the trend, but, but volume wise, there's usually big spike in volume that's at least 50% greater than the previous days before. A lot of times sometimes a. So I just wanted to point that out.
Well, so as far as using panic as a buying opportunity, you're saying that, if I heard you correctly, you're saying that you haven't, if you haven't hit bottom, then you haven't. Then it's really not a panic. So. But the bottom is going to occur after the panic, isn't it? I mean, because in that like when it's kind of repeating out or no.
No, is what I'm saying is as the market's going down and you know, there's relatively consistent volume as it's going down. The market's kind of down every day. There's say example, 100,000 share day after day after day, and all of a sudden you see 200,000 shares. Then that's, that's the point that the market is panicked and that's the opportunity. But if it's consistently going down 100,000 shares a day, then that can go on forever until you do find that, you know, 100, 200,000 shares. And that's the time, the opportunity, I guess is what I'm saying, to step in on the, the opposite side of the trade. And usually if you look at the fundamental side, it's always bad news bottoms. So it's always earnings, didn't reach expectations or some other thing, some bad news. So it makes people fear that the market's going to continue down. But.
Right, well, so as far as it being a buying opportunity. So do you wait until you start to see the volume start to be on the downside of a peak? As far as, like what, like if the market's falling and you know, hitting the, you know, the growing volume coming down, or are you looking for the volume to start dropping off? That, that's, that's the time to start looking to get in, or you want to ride it when it's still increasing volume and it's going down?
Well, like I said, there's, there's a spike in volume and so you're basically catching a falling knife. That's how they say it in the business. So it's, it's, it's all the.
I.
Guess we, we don't have charts to look at. But if all the charts matter on a weekly, daily or even, sometimes they even show up on a monthly, you can actually take the, the price chart away and just look at the volume chart and you'll see what they look like a finger on the volume chart. And I'll say that that's the, either a high or low, or if it's down volume, it's obviously a bottom. This is up volume is the high. But you're able to pick out without the chart even present, you'll be able to pick out that chart just by the volume or the bottom just by the volume, because that's when the spike happens. The finger, you know, if you look at a bar, bar volume chart, you'll see a finger there. And that finger is, is the panic grid. So, so I've learned over the years that's an opportunity, not a. When everybody's panic, you're actually, I guess you're rushing towards the fire, you know.
Right.
So.
Huh. Well, so you'd mentioned how, you know, you like candlestick charting. So how do you, how do you blend candle candlestick charting in with your volume analysis?
Well, it's, I use counts of chart. It's just easier to read than a bar chart. But there's a lot of other things I do. I again measure average volume up, average volume down. So if you see this big spike in volume to the downside, then normally you'll have a. To define a bottom, you'll have a retracement of just as high as volume on the other side. Now if you don't, then you haven't really seen. You've seen a bottom but not a major bottom. So usually when a bottom happens, you got panic selling at a bottom and on a major bottom you have pretty much panic buying off that low. If you look at all the major lows going back, I don't know, 1900 in the stock market, you have a selling climax. Right after it you have a buying climax. But if you have a selling climax, the market just gradually goes up. You picked a low, but not a major low. Major lows happen when there's major selling. Then right after there's major buying. If there's major selling, then a whole hum rally. That's volume is relatively average I guess to the upside that's just consolidation for more selling coming later. So you got to have selling panic and selling or buying panic. That's how you define a bottom.
So with your style of trading, you're not day trading, you're like probably short term trading.
Yeah, no, it's mostly trend trading. I got long, I don't have a. Let's see, I got long on the S P's April 12, which was kind of a down month and I, I bought that down month because we had a spike in volume at the moment right now I, I'm still long but I think we're entering, entering into a high. This is on the s. P.S. i think we're entering a high in this, this vicinity. So there's probably a high, you know, within the next several days actually some sort of a worthwhile high because of cement readings and stuff and. But I do stuff with VIX too. I don't, I don't want to get too far into the weeds of technical analysis. But if we can stay on volume, the volume is on this last rally ups kind of weak compared to what it has been. So there's less energy to the upside.
Yeah, no, I was mostly inquiring like as far as what kind of time frame you like to trade. Are you, are you like monthly? Monthly?
Okay. Yeah, so I'm looking for trend trading. You know like I said, I've been in eight, you know, so I've been in three months long. So I make about, I try to cat catch the major swings for the year. So I'll make maybe six, seven trades a year and I'm trading the S Ps. A lot of times I trade the gold market and I trade stocks too but for my customers I trade the S P's and the gold market.
Gotcha. Okay, cool. So as far as the candlestick, you just like it because it's a little, a little cleaner to read. You're not getting all super, super, you know, candlesticky about it, you know, looking for dojis and hammers and all the, all the specialty candles and engulfing patterns and all that kind of stuff. You just, you just like it because it's a cleaner looking chart.
Yeah, it's cleaner looking chart and also it works pretty well on the weekly charts. It pops out a lot easier than a bar chart. You know, if you look at a weekly chart and you go back several months or something like that. The council chart seems to pick out pretty easy, you know on a daily here today if we close where we are, looks like it could be a dark cloud cover or maybe a bearish engulfing pattern. I don't know sure what today is but volume is going to be higher today than yesterday. That means today's high will be tested. So today's high if tested if tomorrow or next week, then I'm probably out of the market long position but it won't be maybe multi weeks or so because I think the summer doldrums I guess we're heading into and usually you don't get big runs during the summer.
Go ahead.
So, so, but, but you know volume plays a huge part. Panic plays a huge part in my technical analysis and I have a lot of type different indicators that help define panic. If you're familiar with the trend D R I N which is Richard Arms back in I think 70s invented it which is easy to cease now. But what that trend is is advancing issues over declining issues divided by advancing volume over declining volume. So it takes in price and volume all in one little reading and they call it the trend or arms index. And Readings one mean the up volume and down volume and advanced decline are pretty much similar and doesn't really say much. But if you get up around 1.2 or higher than 1.2, you're starting to see panic. And as you go into lows in the market, that trend reading will sometime approach, you know, two, two and a half, maybe even three. And that kind of implies there's about 300% more down volume than up volume going down into a low. So you're definitely seeing panic, more stocks going down and more volume on the down stocks. And that's another reason to how, how you can tell there's panic in the market. So I do a lot of stuff with trends too.
So, so, so how long ago did you start as far as helping other traders and teaching other people your method and stuff?
I was kind of, actually, I, I, I was a, in a broker, actually in a brokerage firm and I had a inner house market letter, just the inner house. So I, I sent out this little letter actually over when I sent this little letter called Timothy Timely tips is how I named it and went out at all to the branch offices what I thought about what, what was going on in the market. And everybody liked it. And so I did that for several years and, and gradually I started the Internet kind of started popping up in late 80s, early 90s. And I'd text my stuff to different brokerage firms just for free. You know, here's what I think and stuff. And that kind of took me one clip closer. Then finally in about actually late 1989, I started sending out, you know, I got people from different brokerage firms ask me, you know, about this stuff. So anyhow, I started the market letter through fax service. I sent out a fax was super expensive back then and it was, and they had fax software that would mail out or send my fax over the modem slowly and sometimes those connections would drop. I have to get back, you know, and re enter that, type in the phone number and send it to them. And that's, I started through a fax service back in the very late 80s, early 90s. And that lasted a couple of years until the Internet became more, you know, accessible I guess. But I did it vax for a number of years. So it was frustrating. It wasn't hard doing all the technical work putting the market letter together. It was the hard part was just trying to get all the information out to them because you get dropped lines all the time and so you had to re, you know, get up a Couple hours later and find out who didn't get there, you know and resend it. So I didn't ever get you know I started in the morning about 7 o' clock and I and I get my market letter done about mid afternoon and took about another six hours to get the report out to everybody. It's just that was the hard part phone calls and plus you paid for it long distance phone calls back that was a big, pretty big bill phone bill back then.
Oh yeah, yeah A couple hundred bucks.
Yeah oh take that times three or four or five sometimes it was, it was expensive. Oh yeah. So you know it, it was a mess and plus they call and so that was back and forth but anyhow it started off slowly. Revenues were, were not great back then but once they everybody got on the Internet and that became that was a lot easier now so and back then there was not a lot of guys like us back then so the clientele were you know there's much more you know if a guy wanted to tickle an analysis, you know they had maybe a couple of hundred nationwide described to I mean I don't know how many there was exactly but there wasn't like thousands like they have now so so you had a lot of people ascribing to you so you know they paid for the phone bills and stuff but it was quite, quite the management that hard part was just managing all that you know, faxes and stuff. It was a headache.
So well so what are you doing lately as far as you know helping traders and so what do you got going on over the Oracle?
Oracle it's we're long right now and actually this year next couple of months could get choppy but we're long the market this year we've been I don't know we're up about 12% so far this year and we may stay out of the market next couple of months and I think you still got another 10% higher than approximately where we are right now but next couple of months could be choppy. Gold market we're long gold market actually that was a big bottom back in 2022 about between August and October that was a major low and market Gold market's been as far as the gold stocks they've been really taking off since March. They're up not quite a hundred percent but close to it and I don't see a top yet. So that's what we're doing. Last year we're up 28% year before I think that was Covid year the market was down 28%. We were up, we were down 3% but Mark was down 28%. So this year we'll be up, we're up double digits so far. We'll probably be up 20%, maybe 25. We get lucky. So it's been a good year last couple years been very good years actually. So this money supply, if they keep expanding the money supply them bull market will continue. So that's where, that's what happens. So if they restrict the money supply that's when you get these bear markets and so I don't know what they're going to do but fundamentally if the money's there a lot of times that finds its way into the market. So that's what's been happening here. But it's inflationary. That's the reason why gold's going. So.
Yeah, well, so, so we get back over to your site. So as far as your newsletter, how often do you publish a newsletter?
My market letter comes out four days a week, Monday through Thursday and sometimes Friday. If it needs to come out and say something or if I make a signal I send out an email right before the close, right at the close and where I'm going flat or whatever but it comes covers the equity market which is the SPX and the gold market and it goes in depth and I usually four days a week, which is three days, three pages of market analysis gets right to the point where I'm looking about what I'm talking about and right now the market's getting a little frothy far as cinema is concerned. So I point that out, show charts of what I'm looking at stuff. So it's quite a bit chart heavy and I point to. So I'm a visual guy rather than a, an English major, I'll put it that way. So a lot of my stuff is, is on the chart and this is the reason my point to the arrows on the chart. This is the reason why I'm worried about, you know, the next week or we're nearing a high and so, and I don't, I, I try to, you know, stay long as I can but when it's time to get out I get out and I'll go flat for, you know, a couple of months and stuff. So it's not like I'm trading wildly again. My trades are six, seven, maybe eight trades a year. So it's not a lot of trading. So it's trend analysis why I try to stay with Gotcha.
Cool, huh? Well, so you also got your book which People can get at your site, right?
Yeah. Give a site, it's on Amazon too. It's Secret Science of Price and Volume. I do have it on my site but Amazon is on Amazon so you know at some point I'm going to probably adds more information to that but write another book and, and all the stuff I have in that book is, has stood the test of time I guess you might say. If you tried it, you'll see it works. And but I over the years I wrote that, I think it was back in 2008 so I've learned some new tricks since then and that could add to that book. So I haven't wrote it yet but I'm thinking about it here next maybe a couple years. The only book I got out right now is Secret Science Price and Boring.
Right. Well I like a byline on it too and I mean even on your site says you know this. The Secret Science of Price and Volume. Leading market timer Tim Ord outlines top down approach to trading. Identifying the trend, picking the stronger sectors. Focusing on the best stocks within within those sectors. This will allow you to, to excel in a variety of markets. With this book is your guide. You'll quickly become with Ord's proven method and discover how it can be used to make more profitable trading decisions. Yeah, very cool. And of course every, everything's got to be on Amazon. It's not on Amazon doesn't exist. Right.
So yeah, it's true.
So yeah, very cool. Very cool indeed. Well, you got it. You say that you're, you're strictly technical analysis but you got enough, you got enough time in as far as some of the, you know, somebody who's relatively new to the, to the markets. What advice would you have for them? Somebody who's relatively new, maybe been in only, you know, a year or less. What advice would you have for them?
Oh, it's just. Well it's always a struggle because the information out there is, there's so much of it and that's the problem with back when I was doing it there wasn't a lot of information. So you could kind of hone in on stuff more quickly and figure out works for you or it doesn't. Stuff out there now is, is, I mean it's, it's knee deep if not deeper but they're really hone in on, on, on things. I guess to me they get to the profitable side as you can. You know, I really study about volume. There's a lot of books besides my book out there on volume and most of the stuff is actually pretty accurate. So I, I start off with volume and price type indicators or books I guess you might say counts like charting is fine, but it doesn't deal in volume. It just shows you a char. But it's good to know that. But it doesn't incorporate volume with the council charting, but it's good to know council charting in that dojis and all that other stuff we talked about are relevant, I guess you might say they don't produce actually great signals, but they do give you a little bit of information to make, you know, some analysis on. But you need to know what volume is and, and you, you need to know what price is. So I'd head to price and volume books. That will get you on the right track, the best. Yeah, fair enough.
Yeah. Well, another thing, thing about it, as far as just, you know, one thing, one thing I try to impress upon everybody is make sure that whatever method you're trading with, you know, you do, you do want to have a method so you can get good at something. And the other thing is, that's really crucial is make sure you understand the, the reasoning behind the method. Don't describe a method because it sounds cool or it looks cool on a chart. Make sure you understand why it should work. And as far as, you know, volume and you know, Woff's approach to it with volume analysis and everything, I've always liked it because it does make sense. It's like, yeah, if, you know, it's one thing to see a market move, but when you see a market move and there's a lot of people moving it, that, that, that gives it a whole lot more credence or if you, versus if you see a move and it's real thin behind it. So yeah, just from a real basic standpoint. Yeah, I've always liked the, the WYCOM for that reason. It's like looking at price and volume, they go, they go hand in hand as far as, you know, being able to get in and out of the markets and make sense of it and make money. So very cool, very cool. Well, and if for, you know, everybody that's listening, if you want to, you know, swing by Tim's site, that's the ord-oracle.com that's ord.com and you can find out a little bit more about him and you know, his newsletter, how you can sign up for his newsletter if you want to get his book or of course get his book off the, off Amazon. But yeah, if, if you're interested, you know, Especially with stocks, you know. Yeah. Incorporating the volume analysis Tim's. Tim's been at a long time, had a chance to, you know, really refine and hone his, his learnings and his methods and everything. So, you know, if you'll, if this resonates with you, don't just have this pass and be, you know, oh, you know, that was cool. And then you forget about it. You know, tomorrow, if you like it, it resonates with you, go and swing by his site and then check out what he's got. Probably help you out, you know, be a better trader and make better money and trade with more confidence. So, Tim, again, thanks for, for taking the time out of your day to, you know, share your wisdom with us today, man. Appreciate it.
All right. Thank you for having me on. I loved it. Thanks.
You bet. And everybody that's listening, I applaud you for taking time out of your day to, you know, learn about, you know, more about trading and becoming a better trader, more knowledgeable trader, not just chasing strategies and signals. So keep up the good work and again, act on, you know, the information and if it resonates with you and if you enjoyed the podcast, you know, go ahead and subscribe, share it with your friends and we'll see you on the next episode of the Consistent Profits podcast. Cheers. Thank you for joining us today on the Consistent Profits podcast brought to you by Inside Out Trading. Make sure to swing by InsideOutTrading.com and pick up your free copy of break the cycle 10 things you can do to stop reinforcing the past and get your trading on the right track. If you enjoyed the show, make sure to subscribe on your favorite channel and we'll see you on the next episode. Cheers.