Automatic Project Evaluations (Webinar 37)
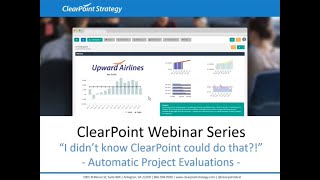
Kathryn and Tricia walk through Clearpoint 11.5's automatic project evaluation features, showing how to set up measure templates, reference series, and evaluation criteria to automate tracking and reporting.
Hello everyone and welcome to the I Didn't Know clearpoint Could do that webinar series. Today we're discussing a highly anticipated feature that will transform your project management in clearpoint, and that is automatic project evaluation. Before we get started, here are your smiling hosts. I'm Kathryn.
And I'm Tricia.
As a few housekeeping announcements, we will be recording this session and we'll make it available online within a week. The webinar will last about 25 minutes with time for questions at the end. So you can submit your questions to supportlearpointstrategy.com any that we don't get to at the end, we'll follow up with over email. Now, on our last installment, we covered another great Clearpoint 11.5 feature, which was Master Measure templates. And not only are these a great way to standardize your data, but they're also very much intertwined with the process that we're going to be covering today. So I highly recommend checking out that recording on our blog, Vimeo channel or support center. You can just search webinar now. Today our focus is on automatically evaluating project elements in Clearpoint. And this is a brand new capability. As of Clearpoint 11.5, the possibilities are close to endless. So we'll start out with some fully formed inspiration, also known as an example. Then we'll back up a little and show you how to incorporate that data and those charts into your project elements. We'll introduce a new calculation type called a reference series. We'll show you how automating projects can enhance your detail pages, and we'll explore those evaluation criteria. And finally, we'll make sure you're equipped to make changes to any automated project. All right, so submit any questions you have as we go to that address on the screen. SupportLearpointStrategy.com and we've got a lot to cover today, so let's skydive right into our Upward Airlines account. Now for starters, let's get a little bit of background information. So what do project evaluations do and when should you use them? Well, when you've been tracking projects and strategies side by side, you might find that you start to merge the management of these two things. So you might have projects where you want to use data to show how you're doing, and you might base your evaluation of your long term goals on the status of your project. So it's really important to have an accurate view of how those projects are really going. And we're actually going to show you the potential for the finished product before we tell you how to get set up. So let's click on our Find New Food Service Provider initiative. And this is a project where at the highest level, the evaluation seems pretty black and white. Either you don't have that new food service provider yet or you do. But of course, a dinner menu on a flight to Rome wasn't built in a day. And we can see here, with our milestones, that there's a lot of steps going on behind the scenes.
We want to make sure there's a consistent way to know whether we're on track with this initiative. How can we tell how far along we really are? It might seem like there's not a lot of quantitative information to tell us that in this particular case, but that's actually not true.
Exactly. So with any initiative in clearpoint, we have our postset complete, the number of OAPS data, our budget, the budget that we've spent so far, and of course, milestones also have several of these quantitative criteria assigned as well. So wouldn't it be great if we had a way to showcase that data over time and use it to determine the status of our project? This is where our automatic project evaluations come in. So you can't see it yet, but we've set up an automatic evaluation for this initiative so that we can use that data to demonstrate our progress over time.
And the fund isn't just restricted to initiatives. Any project element can have an automatic evaluation. So action items, milestones and risks are all fair game too.
Yes, this evaluation party is all inclusive. So here on our initiative, if I scroll down, I'm going to see our information displayed over time in a data table. And here in these two manually entered series, I have our budget and the budget that we spent cumulatively each month. And on top of that, these two series are actually calculating percent complete. So this one here on the left, percent complete, is going to be the average percent complete of our milestones. And we're comparing it here to the elapsed percent complete between our initiative start date and end date. And scrolling down even further, we've also got two charts to show this information, one to track our percent complete and one to track our budget spend.
Either set of comparisons here would be a great concrete evaluation for whether we're below, plan on track or somewhere in between. And we know it's going to be consistent because this automatic evaluation is using the same comparison month after month.
We've actually got our series evaluation field.
Here to show you exactly how that red, yellow, green status is determined.
Yep. So when your leadership asks in your next project management meeting how you can tell whether your initiative is on track, you've got a clear, logical answer at the ready. And you no longer have to keep that project data siloed into measures so your project can play a calculated role in achieving your goals. But let's back up a second. How do we get all of these useful elements, our data table, our charts, these series status fields into an initiative in the first place? You might be thinking, okay, a standard format for measure, chart, data and evaluation. That sounds a lot like a master measure template. And you're thinking, right? Master measure templates can now be used to automatically evaluate your project too.
So, as Kathryn was just alluding to, we're actually going to go through the steps to get to this point of a full on project evaluation by setting up a measure template and connecting it to another initiative. So to get started, we're going to click into our initiative implement WI FI capabilities in all aircrafts.
So you can see here that this.
Is a standard initiative where we have our Gantt chart and a few milestones.
But by setting up a project evaluation.
We can connect this initiative to a measure template in order to pull out these cool features Kathryn was just explaining. So, to get started, we can find our measure templates and admin options under Mastermeasures. So in webinar 36, we walked through setting up two measure templates in Mastermeasures. But that was a few weeks ago, so let's give ourselves a little review on how these work. Mastermeasures are templates that you can link measures to. The MasterMeasure template centrally determines which charts, series, character calculations and evaluations are going to appear in the linked elements. So I've clicked into Master Measures here and I can see that there's a new initiative template that we've just set up. We're going to actually walk through this to make sure the measure template is formatted for our project evaluation. So if I edit the new initiative template and move into measure series, I can see that there's an actual and.
Target series that are here by default.
But these might not be the most useful series to track your project evaluations. So I'm going to go ahead and change these to match what we saw in the example Katherine was showing. So I'm changing actual to percent complete target to elapsed percent complete. And then I'm actually going to add two additional series, the first being budget and the second being budget spent. So now you can see I have the Four series that we want to.
Display for our project evaluation.
And so I can save this measure template.
Now.
Looking up, we have an initiative tracking template and milestone tracking template that was previously set up in this account. You notice that there's an initiative and milestone tag associated with each of these measure templates. This shows that this measure template has.
Been set up to be used for.
These project evaluations for this specific element. So we need to just do the same thing for our new initiative to template and our new milestone template. To do this, I'll save out of Master Measures and click into Project Evaluations. Here you can see we have a section for each element that can use project evaluations, and the measure templates are listed for each of these. So I'm going to choose the correct measure template for each of these elements. So, for example, the new initiative template for our initiative section and the new milestone template for our milestone section. This is dictating what measure templates are available for each element in our account. So once this is set up, I can go ahead and save these.
Awesome. So choosing which master measure templates are available for which elements is a great way to keep from confusing your users. They know which templates should be used for initiatives and which should be used for milestones right off the bat. And this is just the start. So now that we know that these measure templates are the force behind integrating capabilities like data and charts into your project elements, we can go from there. So, as you saw on our food service provider initiative, that means we can track our percent complete over time. And you might be wondering, what is the advantage of having percent complete in a data table when you've had a percent complete field in your initiatives all along? Well, as you've seen, this isn't just any old percent complete series. This series is going to reference milestone information to really determine how complete our initiative is. And this is where a new calculation type called reference series comes into play. So what a reference series allows you to do is to pull information from any quantitative edit or update field in clearpoint and track it in a measuredata table. So these are going to be important in allowing us to track and chart our data from our project elements. So we'll click back into our measure templates to get that set up. And remember, as Tricia pointed out, it's not just initiatives that can get some love from these templates, it's any project element. So first, before we get to the initiative part, we're going to leverage this milestone measure template. And as we go to the series Tab we can see we've got a percent complete series set up here where we want to track our milestone percent complete. So I'm going to click to edit this series and head over to the Calculation tab. And here at the top we can choose from our calculation types in clearpoint. And this is where I'm going to want to select reference series. So immediately here I'm going to see a change in how our calculation is going to be set up. In our dropdowns, I can first select element type. So I'm going to choose Milestone from this list. And here below I can choose a reference field. And this is going to be a list of our quantitative fields in clearpoint.
And in case you're not sure whether your data is quantitative, this has to.
Do with field type.
If you enter 33 into a currency field, the ClearPoint system will know it's numeric. If you enter the same number into an HTML text field, it could be anything. So this won't be read as a quantitative field by clearpoint.
Yeah, that's a really important distinction to make. And it's also important here to note that any scorecard specific fields that you've set up can't be used in these reference series in your measure template. So this template could be used anywhere in clearpoint. So it's not just restricted to those scorecards. You want to stay away from scorecard specific fields. So we'll select our percent complete here, and this is going to pull in whichever value is in the milestone percent complete field into our data table.
Now this is where things get pretty cool. Once I have my percent complete tracked in the data table, I can treat it like any other series. And what that means in our case is that we're going to utilize that milestone data at the Initiative level. Here we're going to aggregate the milestone percent complete to find the overall average for the initiative. Yep.
So let's click into our Initiative template now over to the Series tab and find that aggregate average for our percent complete. So we'll jump over to the Calculation tab and this time our calculation type is going to be an aggregate series. So we can keep our data here from all scorecards. But for those of you that are super familiar with aggregations, you can see that there is a new drop down in town and that is our aggregate element. So here we're going to choose Initiative because we want to base the data included off of our current initiative. And in the next drop down where we select elements, we're going to choose the milestones of the current initiative so that we can take all of those into account. We'll be using a percent complete series. So we're going to set this to series name equals percent complete. And then of course, we're going to be averaging these, so I'll select that from the aggregate type dropdown. Then lastly, we're going to treat blank values as zeros so that we can get the full picture of our milestones and not just the ones that we've started already. All right, so let's save that. And our percent complete series is ready. But there's one other series that we want to address before saving. We want to get a really objective view of the elapsed percent complete also. So we're going to use a reference series to pull in a default field from pairpoint about the initiative. So in our elapsed percent complete series, again, go to the calculation tab and this one's going to be another reference series. So we'll switch up that calculation type. Our element type is going to be an initiative this time and our reference field is going to be that elapsed percent complete. So what that does is to calculate the elapsed days between the initiative start date and end date as a percentage of the total days between those dates. You don't have to lift a finger to create that calculation.
If you've been wondering how you should be determining the percent complete of an initiative, having a measured template behind the scenes is going to really ramp up your ability to logically determine this data point exactly.
Okay, so once we save, we've now got all this information stored in our template, but how do we transfer that to our initiatives?
That's a great question, Kathryn. So, as Katherine said, we've done all the work to set up our measure template. Now we just need to connect this to our initiative to see the benefits of setting up our project evaluation. So to do this, I'm going to click back into the Implement WI FI capability aircraft. I can edit this initiative. And first I'm going to connect the milestones to our measure template. So I can do this by selecting all milestones editing multiple here. And I'm going to scroll down to the Evaluation mastermeasure field. And then from this drop down, I'm going to select the new milestone template that we were just working to set up so I can save this. And now each of our milestones is connected to that template. Now I'm just going to do the same thing for our initiative. So I'm going to click into our Edit initiative tab. Under the evaluation Master measure drop down, I'm going to again select the new initiative template that we are working on.
So you can see here this in action, where we've got different templates available for our milestones compared to our initiatives.
So I can go ahead and save this. And now you might think that this looks just as it did before, even.
Though we've set up this project evaluation.
But by editing the layout of this detail page, we can see that there.
Are a few more fields available to us.
For example, we can pull out our measure data table as well as a chart, so I can go ahead and save this information. And now you can see and the percent complete series is being calculated. This is being based on the aggregate series calculation we set up in the measure template. So it's actually calculating the average of all the milestone percent completes that it's linked to. Now the elapsed percent complete series is also being calculated. This is based on our reference series calculation that we set up in the measure template. So it's automatically pulling in the elapsed percent complete field for this initiative. Now we can see we have our budget and budget spent fields and these can have data manually entered here. So I'll go ahead and enter my budget data and pull that through. And I can go ahead and also enter some of my budget spent data as well.
Okay. So entering data here in a data table on an initiative works just like it does for a measure. Exactly.
So once I have my data entered here, I can go ahead and just click the save button in the top right corner. Exactly how we do with measures. And you can see how this information has been saved.
Very cool. And this budget actually makes those in flight wi fi prices look pretty good.
I know, right? So now when we scroll down, we can also see our chart here. So this chart is showing us how our elapsed percent complete is moving over time.
So if we want to take a.
Deeper look into this initiative now that it's being evaluated, we can also edit it here. Now you might notice that there are a couple tabs here that we're not used to seeing when dealing with initiatives. So the first one being the update data. So if I click into this tab.
You can see that the data table.
Is displayed here just as it was on our detail page. And I can enter in data into the manual series just as before clicking down. We also have our initiative series tab.
So you can see here there's a.
Series we set up in the measure template. And we also have the ability to add new series to a specific initiative. I'll show that in a little bit later. It is important to note that the Orange Master series cannot be changed here. These will be controlled from the measure template. So any changes to these four series will be done in in Master Measures. In our admin options, clicking into the Charts tab, we can similarly see the chart that we set up in our Master series. And we have the ability to add a chart to a specific initiative. Again, the Orange Master chart cannot be changed here, but needs to be changed from the measure template. So one last thing to note here.
If we move back into the Edit.
Initiative tab for the Reporting frequency option, changing this to a different reporting frequency.
Such as quarterly, it's going to have.
A similar effect when we make these changes to measures. If I go ahead and save this, you'll see that my data table has updated to show quarterly frequency as well as my chart.
Awesome. So these are all really valuable aspects to know once you've enabled that project evaluation. And by linking that measure template, we've incorporated charts, data tables, and calculated series into our initiative, which might be way more than you bargained for in this webinar, but in a good way. You're probably wondering, though, what does all.
This have to do with project evaluations?
Exactly, and it's a good question. Now, with all these similarities between measures and these new capabilities with projects, it's no surprise that evaluations translate to projects in a similar fashion as they work in measures. So by leveraging all this data, we've been building up to the ability to set our project evaluation criteria just like we would for a measure evaluation. And we're going to head back over to our measure template to set that up. So in admin options under Master Measures.
We'Ll click to edit our template and.
We'Ll go back into our Series tab, and we're going to base our evaluation off of the percent complete compared to where we'd expect to be based on our start and end date. All right, so on our evaluation tab, this is a familiar process. You know what to do. We're just going to check the box next to each of these statuses. And then for our green status, let's say we're above plan. When our percent complete is greater than or equal to that elapsed percent complete, our caution range is going to fall between 85 and 100% of that elapsed percent complete. Our below plan status is going to be anything less than that. And when we don't have any information, we're going to show this blue Circle. So we'll click save. And of course, just because we've got this series evaluation in place doesn't mean we've got an overall status for our initiative. We have to do the same last step that you would take in a measure. So we have to change our evaluation option from manual to use percent complete.
So just to make sure I understand, the evaluation criteria for the initiative has to be set centrally in the template.
Yep, that's right. So even if this evaluation option is set to manual, that's going to be the evaluation for initiatives overall that are linked to this measure template. And the reason is that that should give you some confidence in the consistency of your project evaluations too. So in this case, we know that any initiative using this template is going to be green because you're ahead of the anticipated percent complete. Now, just like a measure, if you wanted to add an evaluation to another series, here you could add as many as you wanted.
Right. So another option would be to also add an evaluation comparing our budget spent to our budget, and then select worst series evaluation. That way, if either our percent complete or our budget gets off track, we'll know in a heartbeat. Yep.
So here we're going to say we're above plan if our budget spent is less than our budget. If we're less than a little bit over our budget, call that caution. And anything greater than that is going to be below plan. So if we wanted to use that option to use the worst of those two, we would just set it up here. All right, for now, we're going to just use our percent complete evaluation.
And.
Let'S go back and take a look. Now that we've got those criteria set up, we'll go back to our implementing WI FI initiative. And here we can see where previously our initiative was not defined. We've now got statuses in place based on our milestone percent complete. So when the average milestone percent complete is less than the overall elapsed percent complete, we've got yellow or red. Otherwise we're on track. And there's one more field here that might come in handy now that we've got our automatic evaluation set. So next to the edit icon, I'll click to edit our layout again. Series status and series evaluations.
And you might be familiar with these fields from working with your measures. Yep.
So it's the same exact concept here. Our series status field is going to show any automatically evaluated series along with their status indicator. And our series evaluations will show us the criteria that are in place to make sure that we Know why our series are showing up the way that they are. Very cool.
So the next question you might be asking is, well, what if there's something I want to track for a specific initiative, but not all my initiatives that are using this measure template. So I know I don't want to add another series to the measure template, since that will affect all connected initiatives. So what can I do? Well, you actually have the ability to edit individual initiatives even after they are connected to a measure template, and this won't change the measure template at all.
So even when an initiative is connected to a measure template, you can still add additional series or charts. Exactly.
You can add these additional criteria you want to track for an individual project. So say, for example, you want to add an additional series to our WI FI initiative, maybe a series for percent or number of claims with WI fi, since this could also inform how this individual initiative is doing. But this series would not apply to other initiatives using this measure template. So I know I don't want to add this series to the global measure template, but I can edit my initiative, move into the Initiative series tab, actually add an additional series. Here I can click to add just as I would with a measure and I'll say percent of planes with WI Fi and go ahead and change my data type to percentage. Once I save this, you can see.
That this appears as a blue series.
What we're used to seeing with our measures. And you also have the ability to delete, duplicate or edit directly from this initiative, which shows us that this isn't being used from the measure template. So now that I've added this, I can go ahead and save. And now I can see in my measure data table, I have a percent of planes with WI FI series that I can manually add data to. Similarly to this, the same process, you can go ahead and edit the initiative overall and add additional charts to specific initiatives. But speaking of charts, we can see here that this measure template chart name doesn't really work for this initiative. The chart is tracking elapsed percent complete over time. But the new initiative template, that name doesn't really convey what this chart is showing us. So we note this chart is being pulled in from our measure template, so we need to make the changes from the template itself. So you already know how to make these central updates from the previous webinar on Master Measures. But as a refresher we can go into admin options Master Measures, and we can click to edit our initiative template and move into charts. Here we can edit our chart and we can go ahead and change our name here to percent complete. And moving down here, we can also add additional series if that's what we'd like to do. So let's go ahead and add our percent complete as well, so we can look at both of these compared over time. So once I make that change to the chart, I can save the Master measure page, move back to our implement WI Fi capabilities, and now I can see our percent complete chart along with our elapsed percent complete and percent complete series. And it's good to note that this change will also be reflected on any other initiative that's connected to the measure template.
Awesome. So it's great to have that flexibility to keep things consistent or adjust individual initiatives and other project elements as you need. So I know we've covered a lot of new information today, and I'm sure you have some burning questions about how you can utilize these automatic project evaluations. So here's our first question that's come in. Can you use reference series and individual measures too?
Yeah, that's a great question. So you can also use reference series and individual measures. To show you a good example, I'll go into our budget measure here. So say we have this budget measure and we know we also want to pull in our WI FI project budget to track in this measure. We know this budget from this specific project is fairly large and important to our budget overall. So we want it being monitored at the budget level for our measure. So I can click into the my measure and double click to add an additional series. Going to name this WI FI project budget. I'll keep my currency. But now I'm going to move in the Calculations tab. And similar to what we saw Katherine doing with our measure template, I'm going to choose a reference series. I know I'm going to be choosing my WI FI initiative, so I'll keep my element type initiative. And now I'm going to choose my specific initiative here in this dropdown. And for the reference field, I know I want to pull in my budget field. So once I have that set up, I can go ahead and save. And you can see we have our additional series that's added to our data table and this will automatically pull in the budget that we allocate in our WI FI project initiative.
Awesome. So difference here is that with your Master Measures template, you're really just selecting a field and that's going to adjust based on which initiative or milestone you're using that measure template with. But here, this is a great way to pull in individual project data. So that, for example, you could have a chart with all of your different project budgets shown compared to your annual budget for your department overall. So here's another question, which is, what if I want my status to show it's complete when all the milestones reach 100%? This is a great idea, and there's a really important distinction to make here between status indicators and the completed field in clearpoint. So for our account.
We'Ve gone ahead.
And set up a custom status indicator. That's a purple checkbox that we use to mark things complete, but that's just another status indicator as far as clearpoint is concerned. If we take a look on the Edit Initiative tab, we're going to see this completed checkbox. And checking this box is what's going to tell clearpoint to carry all of your update information forward once your project is really complete, so that you have the same status analysis recommendations and you're not having to update those after you finish working on that project. So with that in mind, there is a way that we can automatically show that completed status indicator. There's just one thing that we need to do to allow Clearpoint to use that in our MasterMeasure templates. So here we have our completed status in our status indicator window and admin option. I'm going to click to edit this status and just enable it for measures. And then what that's going to allow me to do when I look back at my initiative template, is to incorporate that status into any of our automatic evaluations. So we'll go to our Measure series tab and let's just adjust that percent complete evaluation so we can see here that our completed status is now in use so we can select that status for our evaluation. And with the way that we've set up percent complete, it's really only going to make sense to mark this complete if our average milestone percent complete is 100%. So all our milestones are complete, we're just going to set this equal to a static value of 100 and otherwise it's going to be green, yellow and red. But when all our milestones are complete, we'll have this completed status shown. So I've actually gone ahead and set up some additional milestone percent completes off into the future in this new FERG food service provider initiative. Just to give you a sense that we can see here in December, when our initiative is March complete, it's because all of our milestones have been completed as well. All right, I think we have time for one last question here, which is you mentioned risk evaluations. Why and how would I evaluate a risk? That's a good question. So we really did want to keep these project evaluations as flexible as possible. And if there is a scenario that you want to cover for your organization in particular, please do reach out to us. We'd really love to work on that with you to figure out how you can best utilize clearpoint for that automatic evaluation with risks in particular. I know that something that we look at with our risk analysis is the probability of the risk on a 1 to 5 scale and the severity of the risk were it to occur. And those two values can help you sort of come up with a sum or average value that you can use to sort of compare your risks. So since all of those are numeric, there's something that you could track in a data table and align with a red, yellow or green status. So again, for any specific scenarios that you want to explore with project evaluations, we'd really love to hear from you. And that's all we have time for today. Thank you so much for joining us on this episode of the I didn't know clearpointto.webinar series. We hope to see you next time. And happy reporting.
More from Ted




AI in Local Government: How the City of Durham Analyzes Strategy, Risk & Performance

How Coral Springs Won the Baldrige Award — Blueprint for City Excellence | ClearPoint Strategy



AI, Data, & the End of Gut-Feel Strategy: Why Strategy is Becoming More Data Driven

Strategy Needs Accountability: How to Drive Project Follow-Through and Execution

