Benefits of Strategy Reporting & Execution Software for Local Governments
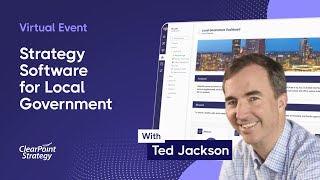
This is a YouTube video titled "Benefits of Strategy Reporting & Execution Software for Local Governments" created in May 2024. It features a webinar presentation with Shepard Smith, head of marketing at Clearpoint, introducing Ted Jackson, co-founder of Clearpoint, who leads the session. Ted Jackson discusses how Clearpoint's software helps local governments improve strategy reporting and execution by automating data collection, calculations, workflows, and report generation. The webinar includes a detailed software demonstration, explanations of features, and a Q&A segment, aimed at helping local government professionals enhance their strategic management processes.
Good morning everyone. My name is Shepard Smith, head of the marketing department here at clearpoint and I'd like to thank you for joining us for benefits of strategy, reporting and execution software for local government. This webinar is set up in a manner I'm sure is familiar to everyone. The audience is muted, but we encourage questions and comments and ask you to please submit them at any point in the questions tab. Our speaker today is Ted Jackson, one of clearpoint's two founders. And there's no one with deeper, broader experience in helping local governments improve their strategy reporting. Ted, please take it away.
Thank you, Shepard and I appreciate the introduction and the kind words. As Shepard said, I am one of the founders here at clearpoint and our topic today is how software can help you with your reporting process. I thought I'd give you a little bit of background about clearpoint and, and then jump right in. As far as my background. Before starting Clearpoint 15 years ago, I did strategy consulting for 10 years with Drs. Norton and Kaplan. And we saw many strategies fail to really gain the traction that they should have because they were trying to manage their strategy in PowerPoint, Excel, email and other tools. And that's why we created Clearpoint. And so today we have more than 200 customers. We're winning awards for our customer success. Best support team, highest performer. We do a tremendous amount of work in local government. So we're really excited that you're able to join us today. When we think about reporting, we think that just that report is the tip of the ice. The part that sinks you is the strategy reporting process, right? So we're focused on automating that entire reporting process so you can focus on making better decisions and driving long term growth in your organization. We say transform the way you manage strategy. So again, just to dig a little bit of more detail into that reporting process, we believe there's a data collection piece where you're pulling data from multiple sources, data synthesis where you're doing calculations, evaluations, charts, and then analysis is, you know, putting the qualitative piece next to the quantitative piece, interpreting what happened and what we should do about it, and then pulling together all the pieces to create that report and then getting that report out to your team to review it. So our agenda today, you know, under the bigger premise of showing how software can help you, is aligning is we're going to try to accomplish five things, right? Is showing you how software can help you align projects to strategy, how you can get data from multiple systems into one place, how to run calculations and evaluations, how to use workflows to automate the process, and how to generate different reports for different audiences. I really think my challenge today is a bit of a balancing act because some of you may be experts or have a lot of experience in doing strategy reporting and are looking to gain that additional edge. And others of you might be new in this journey and are just trying to even understand some of these concepts as I present. So what I'd like to do with your permission is I'm just going to share my screen in clearpoint, logged into the tool and we're going to go through each of these five areas. We're going to save this recording to send back out to you. But, but we also, I'm sure you've attended many of these webinars in the past. Feel free to use the chat or the questions to ask questions. I'll try to see those. If I don't, shepherd will get them. And hopefully we'll be able to bring you along in this journey to learn how you could also leverage software in your journey to be more efficient and effective at strategy management. So with that, I think if I just minimize the screen, we will be able to see ClearPoint. So here we are in ClearPoint, the application. As I said before, we built this tool because we realized the challenges in executing strategy overall. I'm going to give you just a super quick nickel tour before we hit each of these five areas. And yes, this recording will be made available following the session. So you'll be able to get access to this as well. So when we look at an organization, who's managing strategy? This is a fake city called Metropolis. Metropolis has several departments that, that roll up into the city. Super simple because many of our clients have maybe 25 divisions and departments underneath it all that's possible. Their goals, statements of what we're trying to achieve, measures, ways to know that we are achieving that goal, and then projects what we're doing to drive performance in this organization. So it's these items that all link together, right? And so if you're thinking about your strategy, a lot of organizations may say, well, here are goals and here's how we know that we're meeting those goals and put those two things together. But it's being able to link all the actions that you're taking in your organization to see how those actions are driving those results. So if we drill down into a goal like accountable and responsible city government, what we'll see here is there's an owner, some analysis, we have a few measures and we can see that there is a project here, right? And this project is helping us like a website upgrade is going to help us be more responsive kind of on a, on a city government side. And we can drive, drill down into that so we can see the linkage from our goal or our objective down to the project. And when we drill down into a project, we can see there's a lot of information here, right? You can see the percent complete, start dates, end dates, a Gantt chart showing all of our milestones and our timelines. We can be so advanced that we're tracking the, the cost to implement this project against a budget. We're tracking our percent complete, we're seeing variances from that, and we can build charts based on all of this data. Now, we'll probably spend a whole nother webinar going into all the things that you can do to track your projects. But for this one, what we're trying to do for this webinar and for this piece is trying to show how do you link projects to your goals and what would be some of the value of that. So let's go back to that goal. And from here in clearpoint, there are two different ways you can do it. I'm just going to click on projects, double click on it, actually, I can link another project from this account and say, here all my projects. And we could choose any one of those projects, add it, and just like that, we're able to show the connection between that particular project and this goal. And even if you're in the process of reviewing your strategy, which is really important, obviously you can add projects during those discussions and say we could just click the add button and say new project. Right? Of course, in, in my other, my future webinar, we could talk about how you would configure that project. But just in simple terms, we're just adding a new project. You know, here it is right on the page. Then we can assign accountability and get someone doing that. Right? So it's super easy to be able to, to, to add and track all of your projects, link them to objectives and making sure that you're spending money on the things that matter to your organization overall. So there's some cool things that software allow you to do. You can see a project alignment report. Let me just show you kind of quickly what this report is doing. This is showing me all of the goals in my organization and then the projects that I have across each of my departments and how those projects are ultimately linked to my strategy. So again, can we Step away from the software a little bit. The benefit of this is to make sure that our departments are working together to achieve the overall strategy of our city or county. And it's to be able to look and say, are we doing the right things? Could we get a group of departments together to talk about how they manage master plans or public safety events? We don't necessarily need to have different departments running different styles of events and overwhelming our residents. We could just have one big event where police and fire and airport all get together and do a public safety event. So this is really helpful. And of course, if you are tracking all of your projects, you know, there's a really easy way to have dashboards that would track all of this information. We can see the project, the owner description, milestones, and even up here, you know, count and track, you know, what's the percent of my projects that are on track or off track? As I said, we're going to be covering a lot of ground today, so hold on to your hats. One of the biggest challenges. I'm going to switch to topic number two. One of the biggest challenges is getting data all together in strategy management, because information about your strategy lives in different tools and in different departments across your organizations. So I'm going to just show you a few ways that we can get data into clearpoint quickly and easily. As an administrator, what we can do is we can integrate new data into clearpoint. Sorry, let me go down here. To Direct Connections, we have a few ways to pull information directly from financial tools like QuickBooks, Microsoft Dynamics, Project management tools like Monday and Asana, marketing tools like HubSpot and Google Analytics. These are going to pull your standard reports directly into clearpoint. The benefit of that is you can use all that data in the various strategic reports that you have for your organization. The other thing that we have is we have a tool that I just pulled up on my second screen. Apologies. Let me bring it down so we can see it. We have a tool called the Data Loader. And what the Data Loader can do is, is it can pull directly from spreadsheets from CSV files and from SQL queries. So imagine one of your spreadsheets has time periods and actual and target information. We can map that to places in clearpoint. Look at our import options, meaning we could run it manually or put it on a schedule. And if we put something on a schedule, then we just set it once and we can constantly load data in, which would be really, really nice. Right. Kind of across our organization. Same goes for if you're connecting directly to one of your databases like Immunis system. We have many of our local government clients pulling from that and can pull that information in on a schedule as well. We do have a REST API that you can configure to pull information out of clearpoint or in from other locations. Maybe a Power BI or a Tableau or something like that. And then we can do the old fashioned way because not all of our data is going to be easily pulled from systems. So you can also just manually put in data as well. So we could just type in 4,000, 5,000, 6,000. I'm going to hit save here and it'll take us to our next topic, which will be calculations and evaluations. But in this, you can manually load all of this data. It's going to show up automatically in your charts. I know you might be worried about different people having access. You can control that access. And you can also prevent certain series that you have, like your targets, from being changed by all of your individuals. Because as you know, there are two ways to meet your goals. One is to improve your performance and the other one is to lower your target. So don't worry, we've thought of that as well. So the next piece, you know, one of the critical things that a lot of people can leverage software for to really speed your ability to do reports, allow your reports to be more efficient, is what we call calculations and evaluations. So a calculation is trying to figure out something like the variance between my performance and my target, right? And I have a chart of this variance. But how's that chart built? Right. It's a simple calculation here. And in that calculation it's just actual minus target. And the way that clearpoint works is we have a wizard down here. You can select your series and select your periods in time as well. So for that one is just actual minus target. What we could also do, just to give you an idea of how easy it is, is create a new series. Let's call it actual year to date. Go to our calculation. The great thing is we have a variety of calculation types. We can pull information from our measure library, which we'll talk about on another webinar. We can count series or status or aggregate information. But if we just want to do a basic calculation in here, we could pull data from any scorecard in our account. But let's just grab from this particular one and say do a calendar year to date sum. Insert that calculation, hit save. Voila. We have a calculation that adds right on up. And at the end of the year I. The next year starts just after this yellow line. It starts again and starts adding that information for evaluations. That's like making these status indicators turn red, yellow or green with a formula. That's really easy. I'm going to show you that here. We just have a separate tab called Evaluations, and we've written it to read in straight English, so it's really easy. You don't need to learn conditional formatting in Excel or anything like that. Just choose. You know this will be on target if it's greater than or equal to target. Caution if it's greater than or equal to target times 0.95. So within 95% of target less than that, it's red, and if it's blank, it's blue. Not all of your targets are going to be better if they're higher. Like expenses might be better if it's lower. So you could easily change this to less than or equal to or. Or if you're trying to stay within a range, you can use range as well. So it's a really nice easy way to do it. Working on straight math here, we also have the ability to do calculations and evaluations on our project data, and we can roll up information on our goals and automatically evaluate the goals as well. And the nice thing there is goals may be a weighted bunch of your measures or may even be part of your projects. So what we're doing there is averaging or running a calculation. It can be weighted in different ways on your status indicators. So we can get our percents and our currencies to average together by looking at their. Their status indicators. Okay, so we've covered three of the five items we're shooting for. One of the biggest challenges we see in management reporting is in getting everyone to help you out with that report. So if you're responsible for producing that monthly or quarterly report, the real challenge is reaching out to airport, police, fire, getting project updates, getting measure updates, then reaching out to the leadership owners and getting them to give you their evaluation of the qualitative information. So it's like herding cats, right? But don't worry, we built a cat herder. We call it a workflow. And in that reporting workflow, I've got an example here to show you what you would do here is choose what period you're going to report and then what time frame you want people to be making the report. This is a demo account, so we are six months late here. You write some instructions, we're going to send them out to the Owners of this scorecard, Metropolis and all the elements in Metropolis. And we're going to send them an email. Right. The email can be completely customized. You can change all the words, but it's going to give them a link directly to the items that they need to update. So you send this thing out and say, hey, it's time to make your updates. If you were one of the people that received that, it would take you right to your list of items that need to be updated. The great thing is I only have three more items to update. I would just click on the edit I would see here. I could make some quick changes to my percent complete. Of course, we made it as easy as drag and drop. Or you can type in here what we need to be. We could change any information in here, hit save, mark my task is complete and move on to my next task. Right. Fill out the appropriate information here, mark it as complete, move on to my next task. Right. So I only had three things to do. When I do those things, I'm rewarded with the ultimate Internet reward of confetti. Really excited about that. I can go about and complete the rest of my day's worth of work. But the cat herder or your administrator for that strategy reporting system will be able to look and say who's been making all of their updates. Right. Clearpoint Support did all theirs. That's great. You know, Ron hasn't seemed to have done any of his information. I can send Ron an email with a reminder of the items that Ron needs to do. I could copy myself in case Ron says he never received that email. Or I could look and say, oh, Rhonda, I know, she told me she did all of her stuff. She must have just forgotten to mark these as complete. I can mark them complete for her. And overall, I'm watching my strategy get updated by the whole organization. If I wanted to send everybody an email, I could do that and say, come on, team. We only have another day before we're reporting out to management. So it's a great way to be able to keep track of all of the different items that you need to kind of through that reporting process. We view reporting as something we've done a time study with many of our clients, a kind of a before and after clearpoint. And when you take into consideration the person who's asking for all the information and all of the people they need to reach out to, just getting that first report takes more than 80 hours of time. And we're able to save, you know, 90% of that time with these nudges. And you don't have to be the bad guy to it. So one of the other things we've seen that software can really help. This last thing on the list, and I know I'm running out of time, so thanks for your patience. Now is a good time to also ask questions that may have come up. But the last thing we wanted to cover today was thinking about generating different reports for different audiences. And it's one of the big challenges because many times we'll see a finance team need certain strategic data, a board or an executive team need certain pieces of strategic data, a project team needing data. And sometimes when this data gets sent out, it's not all the same. And so then people get confused about it. But in clearpoint, what we have is this ability to send out briefing books of information. That's in clearpoint. Remember, clearpoint's your one source of truth. We can send out different pieces of information to our finance team or to our board or to our project team. Just to give you kind of a quick idea of what one of those reports might look like, it's a PDF document. This is just my Adobe opening up. This one's 30 pages long. It looks like some of the screens that I showed you before. In this case, they have a strategy map. Now we can see some of those detail pages. The great thing is you can kind of navigate around in here just by clicking on some of the hyperlinks takes you right to those detail pages and the same information in here or the information you choose, because we can see the contents from across clearpoint. What you're picking for different reports, you can pick different information for different audiences. But when you talk about your finances to different groups, you'll know you'll all be looking at the same thing. You can set these reports on a schedule and send them out to particular individuals as well. So it'd be really great to have a monthly report go out to your board, or quarterly report, in this case monthly report go out to your financial team. These are your PDF documents. We also have the ability to generate reports in HTML instead of PDF. So imagine you wanted to put something like this on your intranet site or even share with others where you could still click around in it. You can't edit anything, but you would be able to share all of your information with a broad audience. They don't need a login. We can just click on any of the areas. Lots of people love to do this on their intranet site. Many people will also share this with their residents or their citizens as well. So this is a type of HTML report. We also have community dashboards. Arapaho has a great community dashboard. You can see it's branded just like the Arapahoe county in Colorado. We can drill down in to different areas. Like we could look at service quality and then look at timeliness of service, for example, and be able to drill down in see information, these charts. All of the data is coming from clearpoint. All the things within these tabs are coming there as well. You can imagine just navigating one measure to the next. Sticking with our Colorado theme for Collins is leveraging our clearpoint plugin as well to take all of this information, the status indicators you see here, the data you see on this page, and even down to the detailed data that you see on this kind of third level as well. So again, another way to leverage software to make that strategy management process great for your organization. Okay, no, this might be a lot to take in. I said I would try to do a balancing act, both talking about kind of software in general, showing you some pieces of clearpoint. But do appreciate you attending this webinar today. If you do have any questions that come up after this or you want to see your information kind of mocked up or learn how software or clearpoint specifically could help you with your reporting. We're always here to help, so please give us feedback. I'm sure Shepard will be reaching out after this webinar, not only with an item, a takeaway item, but also asking for your feedback so we can answer and show you things that would be of interest to you in the future. With that, Shepard, I will stop sharing and seed my time back to you.
Much appreciated, Ted. Thank you very much. And we do have a question. The question says we do not yet have a formal strategic plan. Should we wait until that's finalized to think about a product such as yours?
Well, I think obviously the way that I've talked about this is like, hey, this is your strategy management system system. You know, how could you manage your strategy if you don't have a strategy? Well, we have some great templates in the tool to help get you started. You know, things like Metropolis, you could then modify from there. I guarantee you in your organization, you are managing your departments and your divisions and your organization. So you do have many of these components. You, you might not call it a strategy management system or a comprehensive view with the alignment that we talked about, but many times software can be a great way to put what you have in a single system and Then see where you're getting that alignment across your organization and look for areas where you can improve. So we have an awesome measure library to show you what other real cities and counties are doing. There are probably 30 or 40 different cities that are in there, as well as several different benchmarking organizations have shared their data. So I think it's never too early to have a tool like clearpoint, even if you're just taking parts of your strategy or parts of your management process and leveraging a tool to really push you to that next level.
Much appreciated. And we are exactly at the top of the hour, so we better wrap up. Thank you everyone very much for joining us. As Ted mentioned, I'll be following up both with a link to the recording and further information. Also, as mentioned, this was meant to be a general overview. And where it really can get interesting is when we have a chance to discuss your specific sources of data, your situations, and draw on all the similar cities and counties we've worked with to give you a bit of guidance. With that. We'll wish you all a phenomenal rest of your day day. Thank you very much. Thanks once again for joining us. All the best.
Thank you. Bye.
More from Ted




AI in Local Government: How the City of Durham Analyzes Strategy, Risk & Performance

How Coral Springs Won the Baldrige Award — Blueprint for City Excellence | ClearPoint Strategy



AI, Data, & the End of Gut-Feel Strategy: Why Strategy is Becoming More Data Driven

Strategy Needs Accountability: How to Drive Project Follow-Through and Execution

