ClearPoint 11: Even More Excitement (Webinar 30)
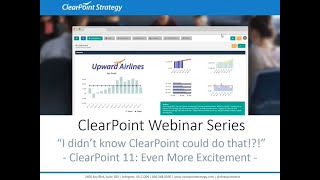
Katherine and Jenna walk through new ClearPoint 11 features: dynamic date filters, upgraded charts, advanced calculations, and updates to the Measures Library. Built for users who want to get more out of the software.
Hello everyone and welcome to the I Didn't Know clearpoint Could do that webinar series. Today we are continuing the release with another round of Clearpoint 11 features. Before we get started, here are your smiling hosts. I'm Katherine. And I'm Jenna and as a few housekeeping announcements, we will be recording this session and we'll make it available within a week. The webinar will last with time for questions at the end, so submit your questions to supportlearpointstrategy.com any that we don't get to at the end we will follow up with via email. So on our last installment we introduced the Recycle Bin, adjustable column widths and more upcoming features. I'd highly recommend checking out that recording on our blog Support center and Vimeo channel Just Search webinar now. Today we've got a whole second round of new features to introduce. It's like how in National Treasure 2 it turned out there was a whole second treasure trove to discover, but better aimed with Clearpoint. So we'll tackle some time saving summary report filters, show you some serious charting upgrades, introduce new features for calculations and evaluations, and walk through some new features in the Measures library. So submit your questions to that address on the screen supportlearpointstrategy.com and at the end we'll answer as many as we can and follow up by email to the ones we don't get to. So let's jump right into the friendly streets of Metropolis. Jenna, over to you. Thanks Katherine. So for those of you who've been tracking initiatives in clearpoint, feel free to cheer. We've heard your request and we've got a major time saver in store. If I click into Initiative. I set up a report here called Projects in Progress and I'll see my Start date and my End date columns next to my Initiative column, Owner column, and my Analysis column. But there's a really wide range here in the start and end dates. There are projects that already ended in 2016 and some that don't start until November. So in order to better manage these initiative reports in clearpoint and keep projects up to date, we've added a dynamic date filter. So let's check it out. I'll click to edit my report and I'll navigate here to our Filter tab. This window looks a little bit different, but don't worry, Katherine will touch on that in a bit. So let's start by adding a filter here. We want this report to show projects that are actually in progress. That is the start Date is before the end of the current period. So for our field let's set up our filter on start date and under comparison you'll notice a new option. We are going to choose our date plus or minus end days at the bottom of the list. Set up our filter here. So don't be intimidated by the drop downs that appear first. We'll say we want dates that are before or after. We'll choose before this time. We can choose today's date or the period end date and then we can determine how many days before or after that we want to see for the start date field. And so for this purpose we're going to choose minus one day. So this filter will show us anything starting before the end of the period, so which we'll call our projects in progress. So I'll go ahead and save this filter and save our report. And so now we'll see that only projects that have a start date before the end of the period show up on my report. Wow, neat. So I see where you're going with this, but it looks like there's a project that already finished in 2015. Good catch, Katherine. Okay, so let's add another filter for that I'll edit my report again, go back to the filters tab and add a new filter here. This time let's filter off of the end date. We'll select our comparison again and at this time we want the end date to be after the current date minus one. So that anything that just ended or has a future end date is what will show up on our report. So I'll click save. We'll see. Now our list is shorter. We have just the projects that are actually in progress right now. And if I go ahead and skip forward another month to March, we have a few more projects on our list now like this update police department master plan. This start dates in March. So now it appears on our report. So breathe a sigh of relief. You will never have to re edit a date filter in an existing summary report again. Yup, it's pretty awesome your filters are set. Unless of course you're adding even more useful filters. And useful they are in clearpoint 11. How could it get more useful than dynamic dates? Katherine, it's not a contest. There's enough awesomeness to go around, I promise. So let's click on our edit window and filter tab and we'll just go ahead and do a little reset here. Delete these filters. Now I'll see at the top here that I have a new drop down. You've always been able to assign multiple filters to your summary report and have all of those criteria applied to each element. But now we're expanding this capability so that you can view a combination of elements that comply with just one of the filters you select. So, for example, if a manager wants to see initiatives that are owned by any of her team members, we'll just use this drop down to select any of the below are true rather than all of the below are true and then we can add our filters. So for our first filter, we're going to filter off of the initiative owner to go along with this example and set it equal to Rhonda, click Save. And then we'll add one more filter here so that the owner equals Maggie Save again. So there's no instance where both of these things would be true. But if we want to see Rhonda and Maggie's initiatives at once, we'll click Save and we'll see them here in this list. So this is really useful for seeing a group of elements that have similar, but maybe not overlapping criteria in common. Right? So another example would be showing elements that have a blank analysis field or a blank recommendations field for easy and very complete updates each month or quarter. The possibilities are really endless. And speaking of endless possibilities, we've got some awesome new chart enhancements to introduce today. So we're going to switch gears and click into our trustee revenue measure over here in the measure section of clearpoint. I'm going to double click on my revenue chart to edit it and you'll see here next to our default chart drop down we have a new button, so let's click on it as you should always do when you see a new button. Famous last words right there. Oh, here goes nothing. That wasn't so bad, was it? More like this is awesome. Here I can preview the series included in my chart in any of our default formats. This will incorporate any changes that you've made to series from the default charts also. So it's a great way to preview chart types without having to click on each one and refresh the chart preview and to find the chart that's best for the information that you're looking to show. So I'll go ahead and pick one here and select it and you will see our new chart pop up right away. Another new feature we've added to our chart, if I scroll down, you can now hide charts in summary reports just like you can with series. So if you wanted to track your data in several different charts on a detail page, but keep it to one main Chart. When you summarize your measures, this is the option for you. Excellent. So now moving on to our Chart series tab, we have a few cool new changes to show. If I expand my chart options my series options here I'll see a brand new sort of beehive looking color picker. This has a more finite set of colors so you know you're choosing the same one each time and you don't have to put in your hex code every time. If you to make your charts match, you can of course still specify your organization text code in the box below the color picker if you'd like to. So if I choose one of these colors, you can see that on the series label the color appears with the non default color for an easy visual reference for your chart series. Lastly, if you've made a ton of changes to your series shape, color marker or anything else, you can reset them all at once by clicking the Reset Series defaults button. We'll click OK and now they'll be reset to the default and you can start the fun of editing your series all over again. Pretty sweet. So for those of you who dive into more advanced charting, we really have some time savers in store for you. I'm going to click over to the custom JSON format tab and we're just going to touch on this briefly today, but stay tuned for a more in depth webinar on how to leverage these new features in the future. So we know that adding code from pie charts from scratch was pretty complicated and now you have the ability to just getchart JSON which will pull in the current chart's code all ready for you so that you can edit it piece by piece instead of having to start with a completely blank slate. So let's try it out now. If we scroll down in our code here, we can see the code for our status legend which is currently aligned to the right and I'm just going to go ahead and change that to align left. So when I click save there you see it. Our legend has changed from the right to the left. It's right where we want it. And that's not all. Clearpoint 11 also makes it easier to save these custom changes as a new chart type that can be applied to new charts in new measures. And we've even got a library available with a few preset changes you can use to upgrade your charts with custom JSON. So as I mentioned, I know this is a tease, but we'll be doing a deep dive into all of these features at another time. So for now we'll move on to our data table and there are a couple of enhancements here that it'll be important to point out. So I'm going to double click to edit this data table in line and we'll see our universal save pop up at the top here. And at the bottom I can see Add series has now moved to the bottom of the chart along with a close button if I wanted to exit out of my data table and keep editing other fields. Now to edit a series from the data table, all I have to do is double click on that series header, double click on the actual header and it's taken me into to edit the actual series. Let's show that one more time. If I double click on my target series now, I can edit the calculation, evaluation or other information about the target. So just as a reminder, currently in clearpoint, when you double click on the data table, a drop down menu appears at the top where you can select your series to edit. That drop down won't appear in clearpoint 11. All you have to do is double click on the name of the series to open up the edit window. It's actually less clicks than before, so easier way to edit those series. Exactly. So for now we'll just double click again and we'll go down to add a new series. And we're going to set up a year to date actual series. So moving over to our Calculations tab, we'll show you a great shortcut here for advanced calculations. Now if you're someone who references our Advanced Calculations article every time you need to use SQL, there is absolutely nothing wrong with that. It is great to double check what commands to use and we love our Help Center. But there is going to be a faster way to access these functions. In clearpoint 11 we're adding a handy reference just for you. So you see this Functions dropdown right next to our operator buttons. This lets you insert a few widely used SQL functions right into your calculation from the Calculation tab. So let's try one out. We'll use a case one function so that we can set up a year to date series that shows the year to date when there is an actual value and shows null when there's no actual value. So here I'm going to use this function drop down to insert case one and then set up the criteria here. So case one, the actual value for the current period is null. Then this is when we'd want to show the actual calendar year to date sum. Add our space in there and here we'll go back to the functions drop down for the else command, which determines what will happen in a different scenario. So if there is no that should say is not null. So when our actual value is not null, then we'll show the calendar year to date sum. Otherwise the series will be null and we can go back to our function drop down to end that calculation and we'll click save. So here you can see we have a year to date actual for when there's an actual value defined, and it's null when there's no actual value. So when I insert my next actual value, we'll see that year to date actual update accordingly. So this is great. We wanted to bring these advanced calculations right to your fingertips. And there you have it. Thanks, Katherine. Now, evaluations haven't been left out of the equation, if you will. Oh, I get it. Calculations joke. Lame. I learned all my corny jokes from you, Katherine. So let's go up and edit our measure here in our Edit Measure window. We'll go over to our Measure Series tab and let's set up an evaluation for our actual series. So edit our series and go to our evaluation tab. So you'll notice here that a lot seems to be missing. But don't worry, that's by design. There were a lot of fields on this page that weren't always necessary, so we've trimmed the fat to only include what you're really working with when you create an evaluation. So let's check the box to select each status we want to include. Maybe that's just green, red, and blue for today. The dropdowns now appear for each of the status indicators that we select here. Then we have our comparisons to select. So let's set on target as greater than or equal to will set below plan as less than, while no information is any remaining values. And maybe we have some static values in mind that we want to use for comparison. And we've added a new feature in Clearpoint 11 to make this easier. This will be great. So keep in mind though, that a static value isn't always the best option, as your targets might change. So sometimes it's better to specify a percentage of another series for comparison. Thanks for that reminder, Katherine. But in instances where static values are the most efficient, you can now select static value in place of a series name in the next drop down and you'll see that the calculation field changes to a value field. And I'll set this to 2500 for this example. I'll do the same for my below plan evaluation and I will go ahead and click Save to save that series. Great. And now we want to set our measure so that it evaluates based off of this actual evaluation. We used to have to go to a different tab for this, but we've actually moved our evaluation option right onto this series page. So now you can choose to use the actual evaluation right up here at the top of the page. I'll say use actual evaluation and save. And there you have it. Awesome. So this is a great time saver. This will make things easier, more centralized when you're setting evaluations for both your measures and your series. So let's switch gears a bit. We really want to touch on some new features in the Measures Library. For those of you that have been using the Measures library, there are a couple of exciting enhancements. So first and foremost, let's go ahead and click over into our Measures library and you can now access 80 key performance indicators that ICMA released just a few weeks ago right here in the ClearPoint Measures library. So these measures and their data were collected through ICMA's pilot jurisdictions as well as their Performance Management Advisory Committee as a way for cities to continue benchmarking after Insights was no longer available. All you need to do to find these measures is filter by contributor and click on icma. So here you can see there's a ton of information that spans all seven of our focus areas. And if I click to preview a measure, I get a long definition as well as a series for each contributing organization. And the ones that contributed data are available there. So these are right here for you to link to your clearpoint measures. And this is just one more tool in your Measures Library toolbox to keep engaging with the municipal performance management community and benchmarking against other high performing organizations. So we're sure you're super excited to link all these new measures to your clearpoint account. Which brings us to another feature. So previously you've only been able to link one library measure to a measure in your own ClearPoint account, but what if there are multiple cities all tracking that metric? Well, exactly. Clearly it would be useful to reference these all in one place. So let's take a look at an example. If we narrow the filter here to public safety, and maybe we're just curious about response time, we'll see that we have a ton of data here for different cities tracking response times, and now we can link them all to our own emergency response time measure. It's like they say in the chip commercials, bet you can't have just one. Exactly. And now you don't have to. So we'll link our VADA's metric here, response time, to our own EMS response time measure close out of here. And now we can do the same for other measures as well. So maybe we want to take a look at Fort Collins and let's go ahead and add one of these ICMA measures also. All right, so when we take a look at our EMS response time measure back in our own clearpoint scorecard, let's go into the Edit tab to find our library measures that are linked here. And you can see that we can now compare to several measures to check on it and see how all my own data compares. So I can preview any of these measures, see the data and the series, and how it compares to the measure that I've been tracking. Awesome. So we'll use history to get back to the measures library and let's take a look at one other area. So if we click over to contributing measure organizations, we organize this into a format that's easier to compare so that you can easily find the information you're looking for. There are several columns here in this grid format, and if we scroll down to our own organization, there's a green pencil icon where you can edit the information if you're one of the contributing organization administrators. And lastly, we haven't forgotten your request for more user access to the Measures library. So you can see that Measures Library has moved from within system settings to sit where non admins can see it in the Control panel. And that is because your scorecard administrators will now be able to access the Measure Library from the Control panel as well as seeing the Measure Library tab in any linked measures in your account that they have access to. But don't worry, only administrators still control what goes into the Measure library. So that's all we have time for today. And we want to make sure to leave time for your questions as well. All right, it looks like we have one here about dynamic date filters. Do dynamic date filters appear for custom fields also? Yes, they do. So if I go back to our Initiatives project report that we set up, I can go ahead and edit it. I have a custom date field here for revised end date. I'll add it to my report and then I'll go to our filter, I'll get rid of these owner filters we added, and I will add a filter based on that revised end date. So here it is. We'll select our date, plus or minus end days, and let's say we want everything that has a revised end date after the current date minus one. Go ahead and save that. And now we have just all of our initiatives that have a revised date of the current date minus one. Awesome. Yeah. So this is available for all custom date fields and to give you an idea of some other examples where you might want to use these dynamic date filters, this is a great way to take a look at projects ending within the next month or the next three months to get just an idea for the upcoming month or quarter of what you're looking at for projects ending soon. So here's another question about the measures library. How will the ICMA data be kept up to date? Which is a great question. We will be adding any updates that ICMA provides to this data into clearpoint soon after they are available. So stay tuned for any of those updates. We'll be sure to announce them, but it really depends on when ICMA edits that data, and we'll make sure that it's available in the clearpoint Measures Library soon after. So thank you so much for joining us today. We'll see you next time on the next I didn't know clearpoint could do that. Webinar and happy reporting.
More from Ted




AI in Local Government: How the City of Durham Analyzes Strategy, Risk & Performance

How Coral Springs Won the Baldrige Award — Blueprint for City Excellence | ClearPoint Strategy



AI, Data, & the End of Gut-Feel Strategy: Why Strategy is Becoming More Data Driven

Strategy Needs Accountability: How to Drive Project Follow-Through and Execution

