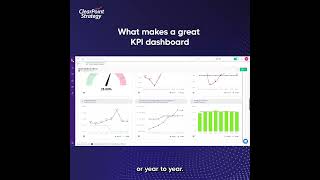
A walkthrough of ClearPoint's KPI dashboard, which tracks organizational metrics and performance over time. The tool generates reports that support accountability and help allocate resources based on qualitative analysis and recommendations.
A KPI Dashboard is a great way to visualize the performance of an organization's metrics over time. First, this dashboard lists a quick overview of some of our important metrics with their statuses, how the data is progressing from quarter to quarter, as well as some qualitative analysis and recommendations to provide additional qualitative information. We scroll down, we can see a visual dashboard displaying our metrics in some charts again showing how this data is progressing from month to month, quarter to quarter or year to year. Do you have any other key reports set up like an ownership report to drive accountability across these metrics or a filtered report showing all of the underperforming metrics you have so that resources can be allocated appropriately? We can set those up and display them on this dashboard as well. From any of these dashboard pages we can click into a specific metric to get more performance information. Here we can see the owner as well as some qualitative analysis and recommendations associated with the metric. Using a KPI Dashboard through clearpoint is a great way to keep track of all the metrics that are vital to your organization.