Jenna walks through how to add and manage KPIs in the ClearPoint tool. The video shows the interface and steps for inputting and tracking key performance indicators.
Hey, it's Jenna. So you're looking for some inspiration for tracking your KPIs in Clearpoint? Let me walk you through adding your first KPI in the tool.
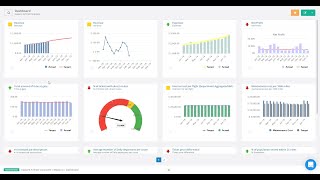
If we start by going to Measures and to our matrix view, we can see a report with our existing KPIs and their status over the past few months. We can also go to our Red alert view Here we can see all of our measures that are behind plan. Or we could go to our dashboard where we can see all of our charts for our measures in a dashboard view. If we want to add a new measure, I'll go to Measures Manage Measures click on Add. I'll give my measure a name like number of employees using clearpoint, select a reporting frequency monthly and save. Then if I click on the name of my measure go to its detail page will add some data in here right away. I can enter it manually or I could set up my data loader to automatically pull data in from another source if I had one that I wanted to pull from here. Strike down my target, save that data. We'll see our chart update right away with that data in our data table here. Can double click to add some analysis. We need some training can save that as well. And my KPI is ready to go.
So go ahead and jump in. Check out our other videos for how to get started with goals, projects and reporting or reach out to our team to schedule a personal demo. Have fun checking out clearpoint.