ClearPoint's new Objectives & Key Results (OKR) Dashboard
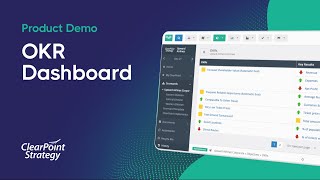
Ted Jackson, co-founder of ClearPoint, walks through the company's new OKR dashboard. The demo shows how teams set objectives and key results at the enterprise level, then cascade them down to individual goals. ClearPoint's system lets you track progress and align work across the whole organization.
Good morning, everyone. My name is Shepard Smith, part of the marketing team here at clearpoint, and I'd like to thank you for joining us to discuss clearpoint's new OKR functionality. This webinar is set up in a manner I'm sure it's familiar to everyone. The audience is muted. We encourage questions and comments and ask you to please submit them at any point in the Questions tab. Our goal is to give you a quick overview of what's possible today, and you're in very good hands. Our speaker is Ted Jackson, one of clearpoint's two founders. And there's no one on this planet who knows more about strategy reporting software. Ted, I'll turn the presentation over to you.
Okay, thanks, Shepard. And I thought for OKRs, it might make sense to start in PowerPoint with a little bit of background, but I would love to spend most of my time in the application itself. So we're going to quickly cover what is an okr? What's the difference between an enterprise or a personal okr? I'm going to jump in the demo, ideally spend most of my time there, and then wrap up kind of talking about CFRs and OKRs. So with that, let's get started. OKRs became very popular recently from this book, Measure what Matters by John Doerr. You know, in this book, we talk very clearly. An objective describes what you want to achieve, and a key result describes how you will achieve it. And the other thing, you know, that you might pull out of there quickly is that, you know, OKRs are set in either a monthly or quarterly basis. And for each objective, each what you're trying to achieve, they're typically three to five key results. And so if we think about OKRs, if you're new to OKRs, but familiar with many other frameworks, you could either find this comforting or confusing, right? Because an OKR and a balanced scorecard, very, very similar, right? They're both systems meant to drive change. They both have the idea of an objective. They both have the idea of a measure. Whether it's called measures or key results, they both rely on your organization's, you know, efforts or motivations to succeed. And again, these are frameworks, as I've told many people in the past, they don't make decisions for you, but they give you that ability to make decisions. We were to think about kind of the differences between these applications or between these frameworks. You know, as I said earlier, an OKR is typically driven on a quarterly or monthly cadence. It's not always tied to compensation. It encourages Risk taking. You're thinking about what's the most important thing in the short term in that monthly or quarterly area. So you may have a lot more leading measures and you can have a lot of linkages across your organization. With the balanced scorecard, you're typically looking out long term, sometimes a three to five year strategic plan. You may still have a monthly or quarterly cadence, but you're driving towards this annual year targets. Typically we see a lot of balanced scorecards tied to compensation and you know, rather than saying what's the most important thing in the quarter, we're looking across kind of a full scorecard of financial customer processes people. We see leading and lagging indicators and you do see a bit of top down in the way you might roll out a balanced scorecard. So, so similar, but there are some differences. You may have heard of another framework called what are your big rocks?
Right.
This comes from Stephen Covey, especially the book kind of First Things First. So I think either is a second or third book, but coming out of that series of highly effective people thinking about what are kind of the big priorities. And when you hear those big rocks or big priorities, think objectives. What are these big objectives that we're trying to accomplish? You may also heard of a nut, another big concept in performance management around key performance indicators, right? And performance indicators are like your measures, right? So in, in a confusing world you have all these, you know, performance indicators, big rocks, okrs, balance scorecard. But in a common world that should be more comforting is we do have this, this common concept of objectives. What are we trying to accomplish? Measures, whether we call them key results or measures or KPIs are using to tell whether we're achieving those objectives or not. Of course you may also have initiatives or projects, things like that in these, these frameworks as well. So one other thing I want to differentiate between is this idea of an enterprise OKR or a personal okr. The enterprise OKR is thinking about my organization or my company, right? What are my five objectives and key results for the company this quarter or for the department this quarter? In that level, those objectives and key results are owned by a group of people, right. And everyone unites to achieve that same set of goals. You may have also heard of OKRs being dealt with at the personal level, right? So it's an individual having, you know, three objectives and some key results associated with them, right? So those OKRs are reviewed by your manager at the end of the month or the end of the quarter.
Right.
And so everyone in the department has their own set of OKRs that roll up at the department level, right. And the performance of a manager may or may not be based on the results of his or her direct reports. So, so that's where you get into personal okrs and enterprise okrs. We're going to cover both really quickly in the demo that I'm going to give. So as I promised, this will be a little bit fast moving. So we start with the kind of that, that PowerPoint. Now let's just jump right into Clearpoint itself. So for those of you not familiar with Clearpoint, you might end up seeing me moving relatively quickly. Don't worry, we can give you a full tour at any point in time after this demo. But I just wanted to start with this idea of the corporate or the department okrs, right? So. So what we have in this world, I'm dealing with a, a fake airline called Upward Air. Upward Air has a corporate and several divisions associated with it. I'm in the eastern division. The eastern division is set up with OKRs, their objectives and key results, right. And they're collaborators or a team of people that are focused on the objectives. So, so let's look at one like ground turnaround. Remember this is an airline, right? And the objective is to, you know, improve ground turnaround. And there several key results associated with that. So we could imagine in this case something like an average plane turnaround we have. We're looking at it each quarter or in this quarter we could be putting in our results. We could end up pulling out a chart very easily. And then we could imagine going through and looking at the second key result, right? Optimizing refueling time. So, so in this world we have our objective and we have several key results and we can pull them together into a bigger picture for the organization of my list of my objectives, what we're trying to accomplish, what are the big things that are important for us this month or this quarter, right? Profitability, reliable departures, fast ground turnaround, and all of our key results. And we motivate as teams of people that are trying to achieve those goals. Okay, so now let's look at OKRs by individual or second way of looking at the, the information. So what I'm going to do here is kind of shift gears entirely and think about someone like James Crockett.
Right?
So James is our manager of sales, but he is also a player coach and he's got three OKRs in here. This means he's got three objectives with key results underneath it. So let's look at this first objective and let's open it up.
Right?
So my objective is here, it's a demo, so it's generically named my key results. I have, you know, three key results that we're trying to get to. We're trying to improve sales revenue, increase the number of demos and increase the number of new deals, right? We can see a starting point and an ending point for a particular time period. And we put in our actual results.
Right.
And so James, if we move the number of new deals up here, what we can see happening is we will turn all of our results into a 0 to 1 scale or 0 to 100% and these results will roll up into my OKR results. So, so you might not have seen it as I moved. Let's go back even down farther to 1. My overall OKR is at 58% complete, which is an average of the 10, 87 and 77% complete. If I run this up, you know, to 9, then my OKR goes on up to 85% complete. And James, who when we look at all of his results is at 63%. If I save these changes, that's going to update as well. So his results will improve overall. So it goes on up to 68%. The other thing that we can do when we're thinking about these results is if James is linking his okr, his objective with key results out to something else that's occurring in the organization, he can link it to those organization wide goals of increasing shareholder value or the organization wide goal of measure of increasing revenue. So we can have this individual OKR that is linked up to a performance management system outside of OKRs or even to OKRs at the team, department or company level overall. Further, we can have a discussion in here where James can explain his performance or maybe James's boss Clarice can ask questions for James about, you know, what's happening related to the school. I'm logged in as Clarice and said, you know, and I can say.
Right.
And we can add comments in here and James can respond to those comments. So if we wanted to quickly see how an OKR is built, I'm just going to click on the, on the OKR itself to edit it. And we can see a lot of features here. We can talk about whether this is like a new OKR that's been created, something that's blocked, maybe it hasn't started yet, or it's in progress or accomplished. So we can have the status for this okr, we can change the name of the okr, give it A full description, assign who the owner is and give it a start and index.
Right?
So you could have, you know, this ending at the end of Q1 or even at the end of a month. And then if we wanted to, we could provide visibility just between James and his manager, or James and the overall department rather than everyone. Since this is a demo, I thought it'd be easier just to show with everyone and then same for priorities. We can determine this is a high, medium or low priority overall and then if we clicked on key results, we can see them. Let me just show you how to add one really quickly. We could add this new result like give product demos. So we want to start at zero, have the target be, you know, five if you wanted to, depending on the measure, you could make this 5 to 0 and it's still going to calculate appropriately. And then as this plays out, this can improve your overall OKR percent complete as well. And then here's where you would be able to create your links. So we can link to anything in any scorecard and in any type of element as well. So let's close this up. And now, you know, what do we see here? Right, so I'm going to show you kind of an individual OKR tree because we, we can see we have lots of people here with OKRs, but there are different ways to view this information. And so one easy way is we've created these things called, called trees, right? And this is just in the fake airline. These are just all the people that are associated with it. And if we clicked on James, we could see his three okrs, right? And you know, as a bonus here we could drill down and see that okr1 is linked to shareholder value and to do revenue, right? And so if we wanted to see how reporting relationships work in our fake airline, we could look at our OKR tree by manager, right? And so what we can see here is that Donald Duff is in the executive suite and Clarice reports to Donald and James works for Clarice. And then underneath James we have Trudy and Izzy and you can see if the individual like James has okr, as we can see is okrs there. But this is a pretty interesting way to see who's, who's completing their OKRs and where they are. And you can see it by organization, structure. And again, so this doesn't become a mad mess of information, if we have just the okrs linking to individuals and their managers, you would have a very smaller set of, of a tree there that's going to, that's that's going to to expand for any particular individual. So the sales team would just see their sales tree versus sales, also seeing operations, customer success, etc. But now that we can see how this team is, is organized, what we can do is we can go back and say, maybe there's a better way to view information. Maybe I would want to view information by manager.
Right.
And so Clarice, remember James reports to Clarice, so. So Clarice can see how all of the people that you know report to them, how they're doing on their OKRs. And if we went down to James, remember James has Izzy and Trudy. Trudy's only got one okr, Izzy has three, and James can see how those roll up. So it's a pretty interesting way for James to say my team has completed 79% of their OKRs. So now I can look into detail about how they're doing and I can add items to the discussion for them as well. So it's a really nice way to do that. If we wanted to look by department, this is just a slightly different view because it takes James, who's also in that department, and puts James okrs in with Izzy and Trudy and then the math just rolls up different. So as a department Overall, they're 73% complete. So. So now you can see, like, you may or may not choose all of these views for the way that you manage, but depending on how you do manage, it's a great way to look across my sales department at their OKRs. Or if I'm a manager, I could look at my direct reports about their OKRs as well. And then one last thing is if we did view okrs by department, what this is doing is showing all of my okrs that are linked up to an element in Upward Airlines or some, you know, goals here that are linked to the Eastern Division or to the Central division. Some people find this easier to view in a, in a tree format. So I'm going to show this really quickly. Just to show, for example, in Upward Air, what we can do is open something like increase shareholder value and see that James has a. An OKR there. Or I could open frequent, reliable departures and see that James, Izzy and Trudy all have goals that are linked to there. So while I take a breath here, I'm going to look at some of the questions that have been coming in. So I appreciate y' all being engaged right now. Key results are going to be evenly weighted within an okr. So it's something that they would roll up evenly overall. So if you have three key results, they're going to roll up 33 and a third percent all the way through. And then another one. Is it a whole new element type or renamed measure element? The OKR is operating as an entire new element type is a little bit in the technical aspects of how clearpoint works, but it's like a combined element. So it has aspects of that o the objective and the key results, but it's operating independently there. So hopefully that, that helped with some of those questions. Feel free to ask more. So it's kind of like before, you know, there's also a good time to stop and say, you know, I've kind of drilled into different trees and different views and, and different individual views. So before we get overwhelmed, let's kind of take a deep breath and focus on the, the big picture of okrs, right? Because, you know, even in looking at this whole list here, you know, you could imagine if you had a bigger team than four or five people like I have in this, this demo, it might seem a little overwhelming.
Right.
So I wanted to focus on a few things. One, typically your OKRs are going to be limited in view to either your department or to your manager. So that's going to make this list a little bit smaller. And we put in a few features in here to really help you sort through this list.
Right.
So there's a filter at the top here. So if we typed in goal one, for example, we would see that Clarice and Izzy each have a goal in goal one. And, and so that's a nice way to filter down on the list. Obviously goal one is pretty generic, but if you had a goal like improve sales or, or a goal to affect revenue, you could type in revenue and see who's in there. And then the other thing you can do, you may have noticed at the top, I have these boxes up here and this is how we evaluate these goals. Right. So some are, if you remember earlier, some are created or blocked or in progress or we've accomplished them. If I click one in progress, it's going to show me my four goals that are in progress. Those are the ones that are are yellow. With these new icons I can click on it again. It takes it off the search, same as if I went to accomplish. It's going to show me my list of goals that are accomplished.
Right.
The other nice thing is if we're on any of these list, so for example, by department, let me click on it. If we were down at that department list where we're like, oh, I really want to, to see like what my percent completes are at any of these lists. We can export our okrs. And what it's going to do is it's going to export it into Excel with all of the data and the math rolling up. So it would see the percent complete of each of these and the percent complete of sales. And this is going to give you that really nice capability to, to be able to manage this however you want. The statuses will be customizable. You know, as we release in version one, we just wanted to start with a set of statuses, so, so thanks for asking that question. At the moment they're not customizable, but they will be. Okay, so by now I know I'm running out of time too. So many of you may be thinking like, okay, are you know, is okrs or are okrs performance management system? Like can I use it kind of as a full performance management system? So I'm going to go back to the PowerPoint. I think this is where you really want to think about CFRs versus OKRs, right? Because in the book Measure what Matters, you know, John Doerr says that OKRs are meant for motivation and alignment and less for compensation.
Right?
And so if they're not for compensation, and they might not be the perfect performance management system, but we've also seen OKRs being used for compensation the same way that we've seen balanced scorecard used for alignment and not compensation or with compensation. So we think about full on performance management. That's where you need to be able to add this capability of conversations. You know what I mean by that is a manager talking to their direct report or a manager talking to their team saying, you know, are we looking at the right set of measures or you know, are we doing things in the most effective way? You know, the, the obvious conversations you do want to have about performance, right? And then feedback, right? You know, do we think we're doing the right activities to drive performance overall or are we doing well in some areas and not well in other areas? And then recognition, this idea of, you know, hey, you're doing a great job on your targets, right? All of these things motivate people, which is part of what an OKR or any kind of performance management system is meant to be. So back in clearpoint, you know, we have that, that discussion field that's going to allow you to have those conversations, to be able to give feedback.
More from Ted




AI in Local Government: How the City of Durham Analyzes Strategy, Risk & Performance

How Coral Springs Won the Baldrige Award — Blueprint for City Excellence | ClearPoint Strategy



AI, Data, & the End of Gut-Feel Strategy: Why Strategy is Becoming More Data Driven

Strategy Needs Accountability: How to Drive Project Follow-Through and Execution

