Getting Started - Updating Charts
14 Aug 2019
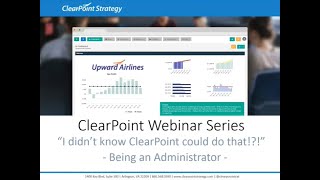
This is a YouTube video titled "Getting Started - Updating Charts" created on August 14, 2019, providing a tutorial on how to update and customize charts within the ClearPoint software. The content is instructional, explaining step-by-step how to edit chart details, series, and periods for reporting purposes.
More from Ted




youtube.com
AI in Local Government: How the City of Durham Analyzes Strategy, Risk & Performance
6mo ago

youtube.com
How Coral Springs Won the Baldrige Award — Blueprint for City Excellence | ClearPoint Strategy
7mo ago



youtube.com
AI, Data, & the End of Gut-Feel Strategy: Why Strategy is Becoming More Data Driven
1y ago


See all content
