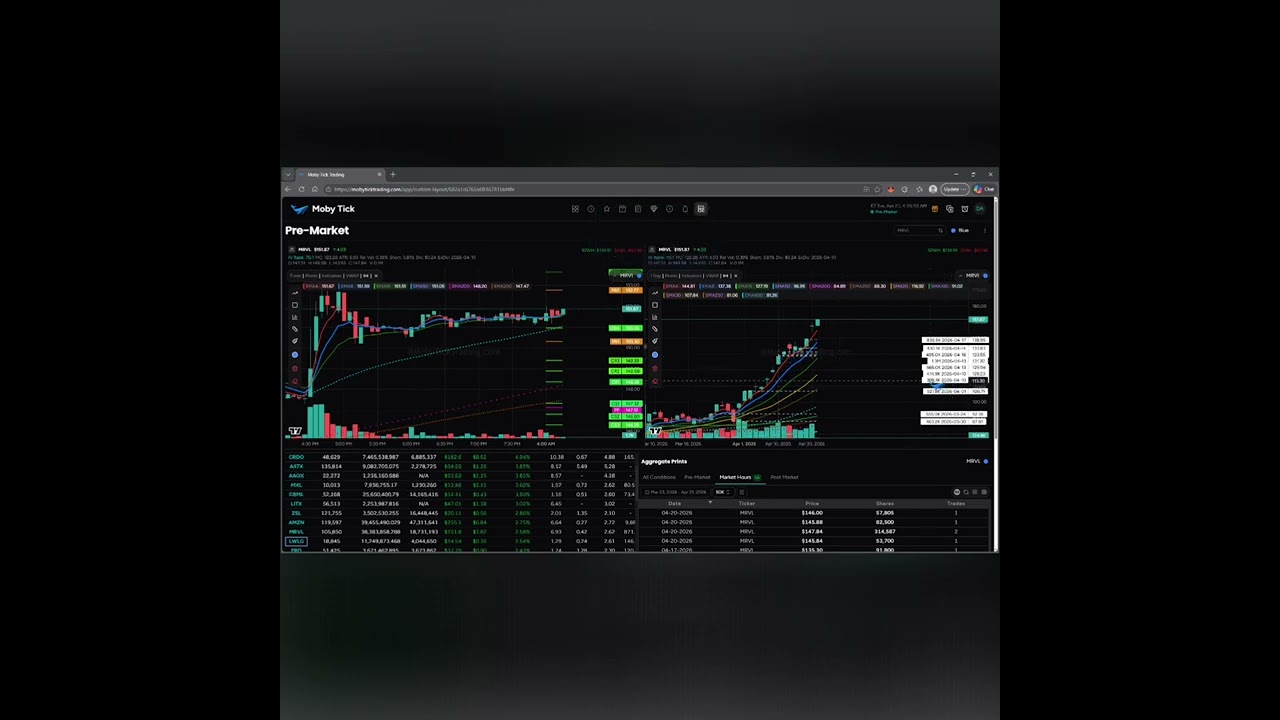
In this April 21, 2026 video, presenter Dave Barnhart delivers a live swing‑trade commentary focusing on two stocks—Amazon (AMZN) and Marvell Technology (MRVL). He walks through the past month’s price action, highlighting key volume prints, moving‑average interactions (50‑day SMA, 200‑day EMA/SMA), pivots, CAMs (Change of Market), and fair‑value gaps. For each ticker he outlines bullish and bearish scenarios, specifying precise entry thresholds, target levels (R1‑R5), and stop‑loss zones based on ATR and support structures. The analysis emphasizes increasing volume on swing days, closing above prints, and institutional accumulation signals. The video concludes with a call to like, share, and subscribe, promotion of Mobitick’s weekly dark‑pool report, and a partnership with TrendSpider for real‑time institutional trade overlays.
Chapters
Good morning, traders. It's Tuesday, April 21st at 4:12 AM. All right, 2 stocks for you today. Both have gapped up a little bit. We've got Amazon and we've got Marvell. So let's go ahead and have a look. These are the latest prints in the last month. We do this every time. So back here we have a low on March 30th. Here there's 2 million right here, and then we started moving up through these moving averages. We got another print here About 1.1 million, and we went sideways for a couple days. We had some waning volume, moved back up. This one closing above the print, so you can see the print right here. And then one, two, on the third day increasing volume, closing above the print, and then we started gapping up. So this is this is kind of what we're looking for: increasing volume on the day for a swing, closing, closing above prints, and then moving up. We got another print. Looks like they're adding to their position as well. And then we got a whole bunch of prints. Look at this: 1,900,000, 1,900,000, all of this here. And so we went sideways, upthrusted to this print, pulled back, and now we're breaking above it again. So let's see what actually happens here. We'll map this out on both sides. Clearly, the long side looks a little easier than the retracement. So we're going to be bullish above 256. We're at 255 right now. Target $257.57 is R3. $258.25, $260, $262.39 is R4. Then we've got $265, $267.20 is R5 on there. The ATR on this one's about $6 on that, so that's why you stop there. Also, uh, bearish blow $252.75. We've got to get down here because We've got the 50 simple moving average. We've got about 1.5 million sitting right here, and we got a double pivot and a cam. So we might have a fair value gap here coming back. So this was the 4:30 PM candle. This just shot up with the news. So 4:30 PM yesterday, and then we could potentially come back to fill this. All the way back down to about here. So let's map that out. We're going to be we're going to be bearish below 252.75, target 250.93, 250.52 right down here. And this is my 200 exponential moving average. And then we've got 249.60, 249.02 right down here is a 985k print. Then we've got 248. 72 is a cam, 248.50 and 247.94 is the pivot right about here. But you can see how this is really, really strong support with the prints and the pivots and cams. So we can potentially come back into this, and that right here is my 200 simple moving average. So I would think maybe this, this candle here might fill. So just be really careful in this area on the retracement trade. Okay, let's go ahead and look at Marvell. Okay, so this one here, the last month, we can see here March 24th, we had a nice 555K print. And so here, this— there's no real volume here. This was the day of the print. We splashed up a little bit, came back in a new print on this low on March 30th. And then the next day we gapped up, tested the print, and started moving up. Is that a wick on the bottom? Yeah, it looks like a wick on the bottom. Tested the print, moving up, increasing volume. That's a decent swing. No wick on top as well. And then we moved up, and it looks like they were adding to their position here. We got a print, tagged the 4 exponential moving average. This one opened, tested the print, opened, tested the print, and then we just started moving up. So they pulled back to buy more. At the position that they want. Now moving back up here in April 10th area, we can see here $399K, $400K, $560K, all of this consolidation in here. And so we went sideways 1, 2, 3, 4 days. And this is interesting here, increasing volume, no real wick on top, testing the prints, and now we're off to the races again. So this looks like it's going to continue On based on what the institutions are doing here. So let's go ahead and map this out. Oh, we're bullish above 152. I mapped this out right when it was here. So let's bullish above 152. So if this is the case, then and you see that it's already through your target, we'll wait for the next one, right? The next possible entry. 152.77 is our two. 153.64, 154 and a quarter. 155, 157.50, 158.42 is R3. So this one has an ATR of about $7 as well on that. On the downside, we're going to be bearish below 150.87. So let's get right below here. This is my 50 simple moving average, but 150.87, that's an 8th. 150.30, 149.39 is a CAM. 148.88 is a cam, 148.36 is a cam, 147.32 is a cam right here, and 147.12 is the pivot. So when we're coming back down here, there's my 200 simple, 200 exponential, and the pivot here. So I would be careful in this area as well. Okay, there you have it. Those are your 2 trade setups for today. So please like, share, subscribe, do all of that great stuff. Subscribe to our weekly dark pool report, which is mobiticktrading.com/weekly-report. Where we do swing trades every week. We do some education. We follow the dark pools, and I give you 13 stocks to trade, including an overview of the SPY, Q, and IWM. All right, happy trading everyone, and we'll see you tomorrow. Take care. Mobitick has partnered with TrendSpider to bring real-time institutional trades to your charts. Click the link in the description below for more details.