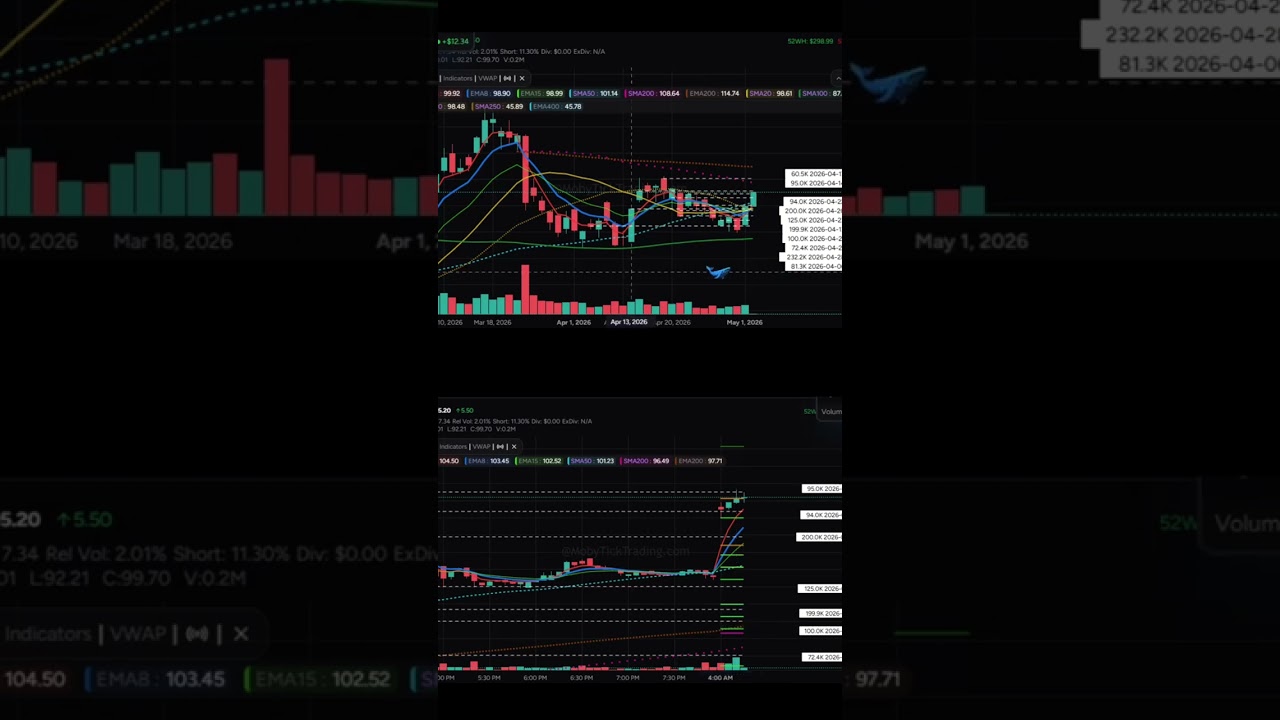
Applied Optoelectronics shows $200M in dark pool accumulation over a month, pushing into a strong uptrend with bullish zones above $193 and resistance at $210-$212. Circle Internet has recent large prints (150K shares) with entry targets above $106 and resistance around $111-$113.
Chapters
Good morning, traders. It's Monday, May 4th at 4:17 AM. Okay, 2 stocks we've got for you today. We've got Circle Internet and we've got AAOI. So let's go ahead and get started. Same old, let's look at the dark pool institutional trades in the last month. Back here we've got a print kicking this off here right around the 92 level, 81K. So We pulled up back, breaking through the print. It looks like they're adding to their position here. We came up here to about 150K, pulled back to test this print here, and then breaking above. So Friday, increasing volume, closing above the 4 and the 8, closing above recent prints that were consolidation before, and we're taking off a little bit here. So the only thing that we have here, if we get above this 111 So 110.22, 111, about 114, we've got my 200 exponential moving average. And then let's see if this continues up to the top. But look, we've got this higher high, higher low. Let's see if we make a higher high here. So let's map this out on both sides of the trade. Looking over here on the left side on the 5-minute, we're going to be bullish above 106. We've got this 95K at 105.49. Plus it's super early, so we'll probably move up a little bit. 106, 107, 108.13 is a cam. We got 109, 110, and then we've got 111, and then 112.91 is R3. So on the downside, we're going to be bearish below 103.99. Let's get below this cam right here and this print. So we want this to be resistance. This print. So what we could do is break down, maybe test the print and start moving lower. Then we'd go to 102.89, which is this 200K print. 102.40, 101.84, 101.13, 100.42 back here. And then 101 is 125K print. This gets us to the post-market low that's here. You can continue down a little bit I, I've picked this really as the end of the road, but if this continues down, you can definitely come down here to the 99 level and then potentially down here to my 200 exponential moving average. But there's lots of prints here. This seems to be quite strong, but it might pull back a little bit. Let's go ahead now and look at AAOI. Okay, so this one I've called out several times in the last couple months. This one's moving. This makes, uh, optics and things for data centers, parts, things like that. So looking back, you can see it doesn't get massive, massive prints. The largest one here is a 418K. So when you're looking at the dark pool, there's different print sizes and they behave a little bit differently. But this one kind of kicked it off here in the last month around the 107.45 level, 277. Okay, and then we shot up and went sideways for a while as they added to their position. So we've got a print here testing the print, moving up, but there were more prints pulled back, tested the print, moved up, come out, test the print, hold, test the print, increasing volume, moving up, and then we're off to the races. So you could probably get into the swing trade here with the increasing volume. And the 4 and the 8 are running together here as well. And then we're moving up. So it looks like if— and I'll show you something— if we switch to the week, there's no real prints. There's this 122K from Thursday, and it seems that it's going, continuing to move. So I'll switch this back to the month so we can see. Now we are going to be bullish above 193. We've got this 192.82, this cam right here. So we want 193. We'll probably tag 193. And if and pull back to this 182, 192.82, and if this holds, then we've got 195, 196.25, 197.58 is R1, and then we've got 200, 202.13, 204, 205, 207.50, 210, 211.65. So this is a massive almost 10-point run here. The ATR on this Is $18.43, so this seems reasonable, and if this continues, then sky's the limit here, right? R3 is $245. That's, uh, that's quite a bit. Anyway, same sort of thing, 4 and the 8 are running together, no reason to get out of the trade. Bearish below $186.50. Let's get below here. Target $186, $185, $184, $182.50. 180.41 right here. Then we've got 177.80, which is the pivot. There's a double pivot— a pivot, a CAM, my 200 exponential, 200 simple. So that would be my target here for that. Okay, there you have it. Those are your 2 trade setups for today. So please like, share, subscribe, do all of that great stuff. Subscribe to our Dark Pool Weekly Report, which is mobiticktrading.com/weekly-report. First name Email address, and you get our trade setups for the week for swing trading. Review the dark pool prints, do a market overview, and we learn something new every week. All right, happy trading everyone, and we'll see you later. Take care. Bobi Tick has partnered with TrendSpider to bring real-time institutional trades to your charts. Click the link in the description below for more details.