AMD & QQQ: Crucial Stock Levels for Traders Today! #shorts
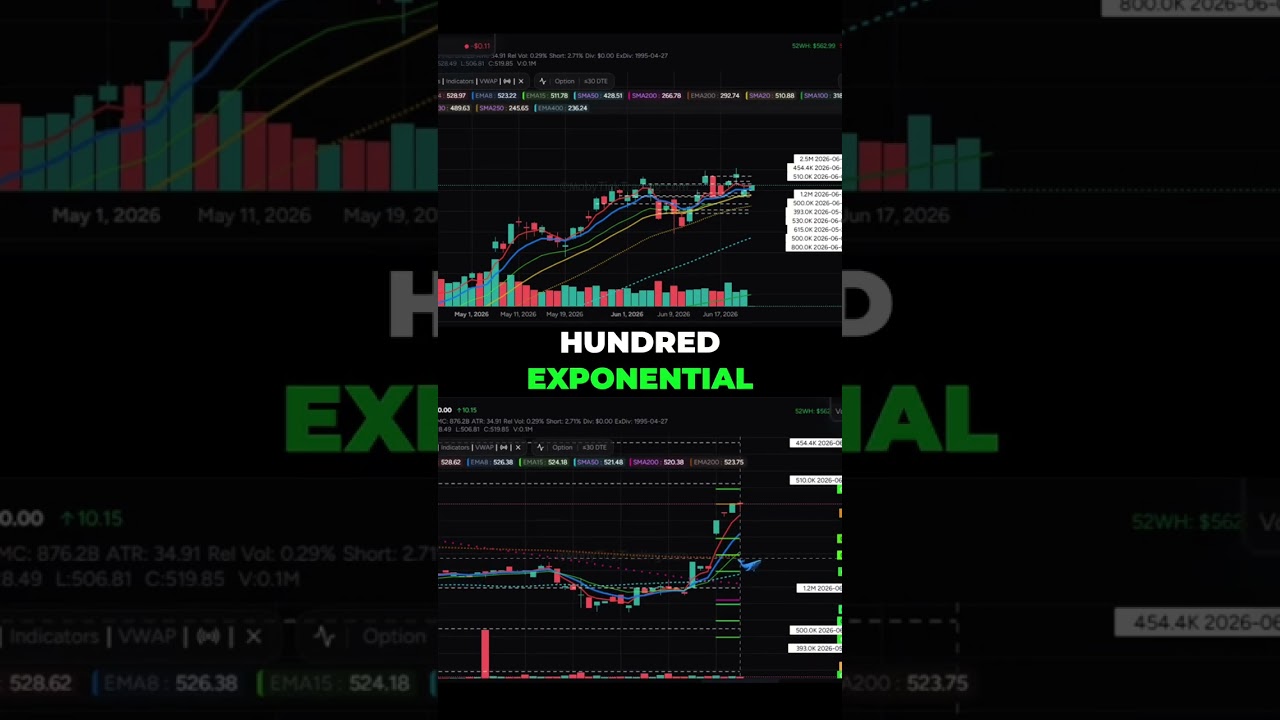
In this YouTube short, the speaker provides an intraday technical analysis of AMD (and references QQQ) focusing on recent large‑share “prints” that indicate institutional activity. He maps out a series of higher highs and higher lows, identifies key support and resistance zones, and aligns them with the 200‑day exponential moving average (EMA), 200‑day simple moving average (SMA), and the 50‑day EMA. Specific price thresholds are highlighted: bullish momentum above $532.50 with targets at $537.37, $540.06, $542.09, and a critical breakout level at $547.50‑$550; bearish pressure below $525 with potential decline toward $475 and the 200‑day SMA. The commentary also notes the size of recent prints (e.g., 2.5 M shares at $547.26, 1.2 M shares at $519) as markers of institutional interest, and cautions traders to watch these levels for entry, exit, and risk‑management decisions.
Chapters
More from Dave






ServiceNow $SNOW & Hewlett Packard $HPE earnings trade setups following Institutional Positions


GTLB GitLab Explodes +$10.31 Breakout! vs CRDO Credo Technology Major Dark Pool Flush


Massive Dark Pool Prints on Nasdaq $QQQ and Gold $GLD! Smart Money Positions revealed
