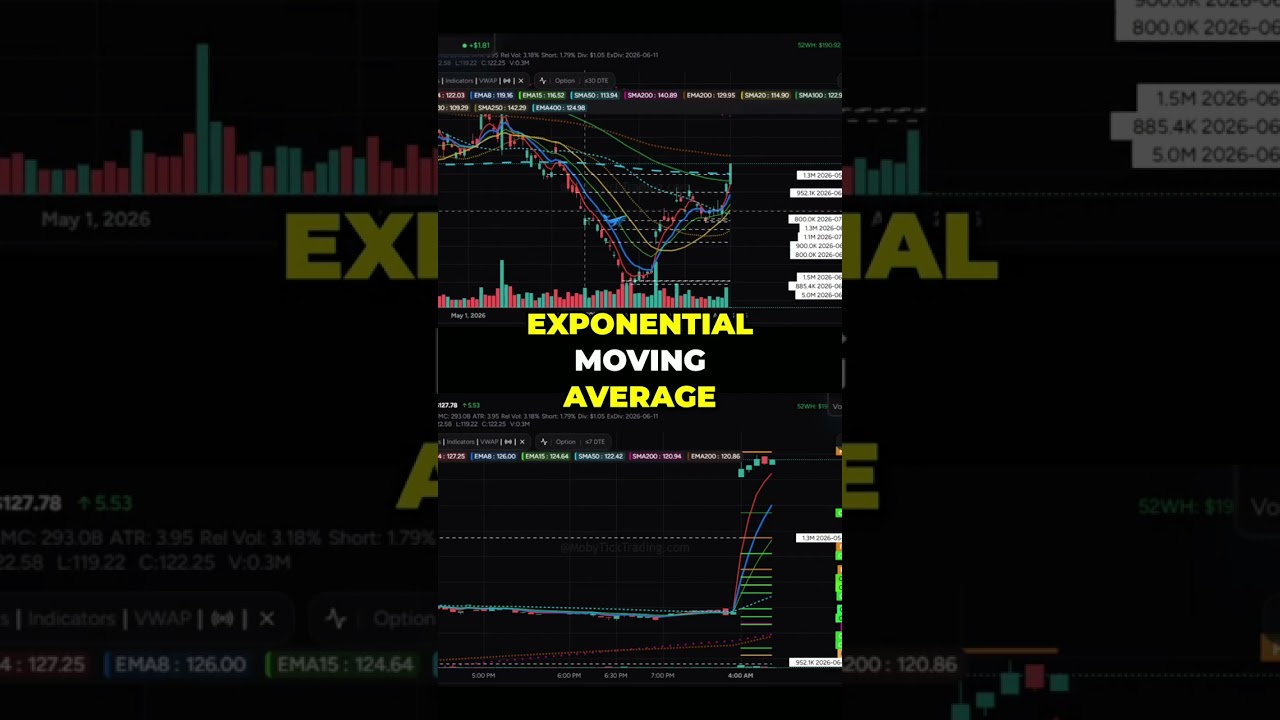
Alibaba stock shows higher highs and higher lows with large block trades of $1.5M, $800K, and $5M signaling smart money interest. The 200-period moving average marks bullish territory above $28.25, with resistance targets at $129-$130 and $145, while support sits around $124-$122 with $4-$5.5 ATR volatility.
Chapters
All right, switching over to BABA. Okay, largest trades here. You can see this bottom in here, $1.5 million, $800K, and $5 million here at the bottom around June 26th. And we've been moving up through these previous prints. Let me zoom out a little bit. You can see this starting back here, looked like we bottomed out. Higher high, higher low, and we're breaking above now. And we've got a recent May 29th, $1.3 million, and June 9th. So this one here, look at this increasing volume here on Friday, and then looks like we're moving up about $130. I've got a 200 exponential moving average, so let's go ahead and map this out on the intraday. We're going to be bullish above $28.25. We've got this R3 which is usually overbought. Target $129, $130, $130, $145 is R4, and then $132.50, $134, $134.81 is R5. ATR on this one is about $4, $3.95. We're at $5.50 already. This Look quite strong today. We're going to be bearish below $127. Scar 2 and a 1.3 million share print. Be very careful shorting it here or continuing on. This might be very strong support if there— if these prints still hold. Then we've got $124.10, $123.48. You can see this here, this is— we're getting really tight in here. $123.18, $122.87, $122.56. And I stopped at $121.94 down here. Even though these are a little bit tight, this The postmark support where this gap—