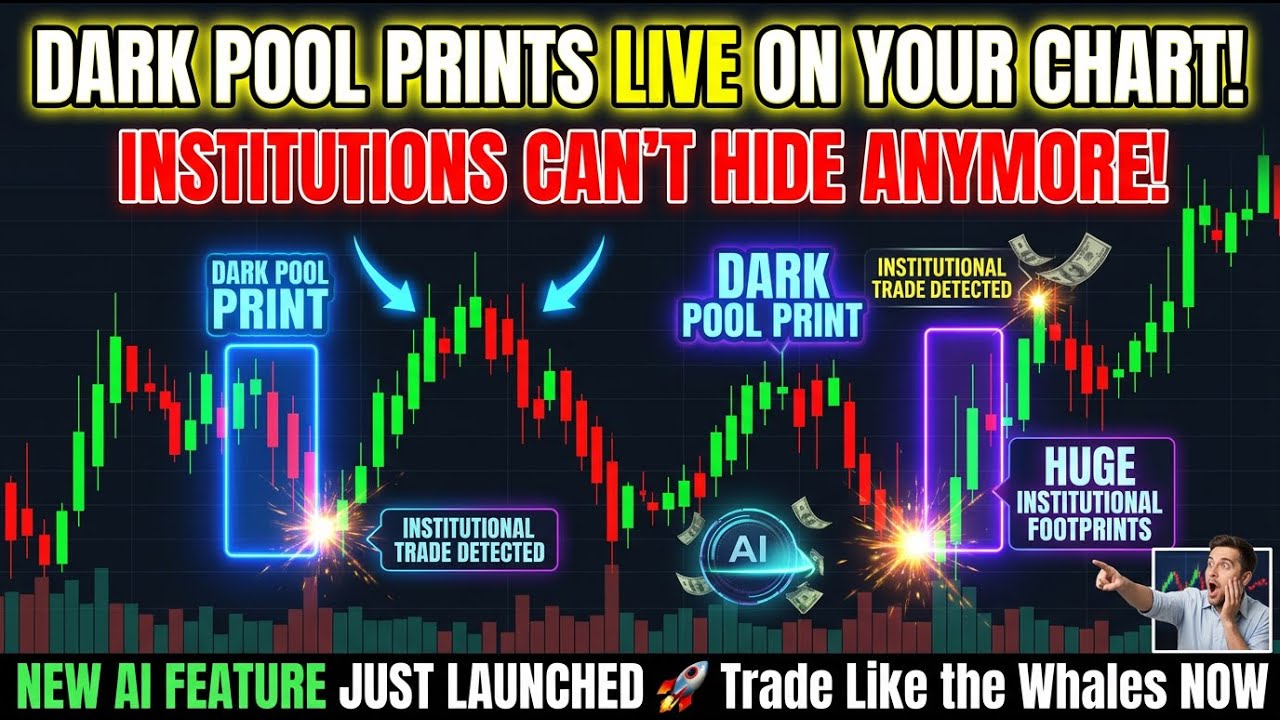
In this video, the presenter walks through Mobi’s new live‑trades/dark‑pool‑prints feature on an intraday SPY chart from the morning of March 13, 2026. By enabling the live‑trading toggle, real‑time block trades and prints (e.g., 168 K, 100 K, 1.3 M shares) appear directly on the chart alongside time‑and‑sales data. The narrator explains how each print aligns with price action, acts as potential support or resistance, and reflects institutional positioning. He integrates technical tools—4, 8, 15‑period EMAs, an anchored VWAP, and a pivot level at $667.86—to contextualize the prints. Throughout the session he evaluates whether recent prints hold, discusses price manipulation (“print pong”), and outlines possible trade targets (e.g., retesting the pivot, moving toward $671‑$672). After recording, he provides a brief update showing that the price tested the pivot, held above key prints ($667.96, $668.24), and suggests the prints may become new support for a potential upside move. The video concludes with a call to traders to experiment with the feature and use prints as dynamic support/resistance zones.
Chapters
Hey traders, check out this new feature in Mobi. You have live trades on your chart. So right now it's, it's the morning, it's 10:10 AM Friday, March 13th. We're watching the SPY here and we can see that pre-market we've been moving up. But look at this, if we tick this box here, which is the turns on live trading, anything that comes in during the day in real time shows up on your chart. So you can see this March 13th, 670,108, 165,000. Then we've got the 669,190, 100,000. And so in my custom layout that I have here, I've got a block trade indicator for the SPY, but I also have the time and sales. We can see that what's going on there. So we can see here that, that 9:49 AM, we got this 168K print, right? So that's right here, right at the close of this candle. 168K, that was an upthrust. Now this print actually has to hold, but we had increasing volume. It was tested breaking below the print. That's fantastic. And then just now we, we got the, uh, 669.19, 100K, right back here. And this one was at 10 So that's the end of this candle. Now we're going to see if this actually holds. So when you're trading and seeing where the institutions are positioning, even with smaller share sizes like this 100,000, 168K, you know, this is millions of dollars here and they're filling. So what tends to happen is you can get like print pong going on between these because they manipulate the price. To get it where they want to. So if I go and say add the prints for the last week on there, you can actually see there's a 1,300,266. Okay, right. So it looks like they're selling off this rally. So here on the right-hand side, it's doing it the same. What we did here is we opened and we shot up through this 4 exponential moving average. And now we're pulling back, and so it's an inside day at the moment. You closed yesterday, we tagged this 161 exponential moving average, and then I've got an anchored VWAP that's here. So this was below. So right now, yeah, there's a bit of a sell-off here. So where's our target? Well, let's see if we hold these prints or maybe get back to the pivot here at 667.86. And we'll just, we'll just play around with it because when this breaks below like this, we've had this run-up pre-market which was great. The 4 and the 8 exponential moving average were running together. The 15 tend to be holding along. This is the 15 exponential moving average, but you're getting these breaks, retest, retest, and then into the open. This was great because this, this opened, moved down, up, increasing volume. And then that was a great trade up to this 671.84, which was this cam. We pushed high to 672.34, started turning around. Now we're coming back and see here there's another print that just came in, 135K, 668.78. Now that's down here, and we'll see if this holds. So now they're building a position here, so if this doesn't hold Then we can pull back. So when they come in, you might want to consider taking some profit on the downside, especially, especially here with there being wicks at the bottom. So we'll see, we can come back up and test this now, and we'll, and we'll see how that actually plays out. So this is great watching this throughout the day. You can turn that off, or you can turn it on. As you see fit. All right, there you have it. Hopefully you enjoy that. And— or we're watching prints all of the time, and we look at the larger prints for the swing trading, and then when we're mapping it out during the day, they're actually support and resistance, larger ones as well. But then when you see the manipulation come in, I dare you to put that on your chart and watch it as you're trading and see. All right. Happy trading everyone and enjoy the new features. So just an update here when I was recording the video, it's only a few minutes later. What we had called out was the target back to the pivot $667.86 before the bounce and this one came down here to a low of $667.75, so 11 cents below our target there and but look where look where it's holding here is these prints $667.96, $668.24, that's one point four million shares here. So we've got this and a wick, and it's trying to move up. So let's see if these prints here can then become support. Then you can have another run-up, maybe to test these ones back up to six seventy one on that and potentially higher. Okay, there you have it. These these levels actually do work quite well. Happy trading, everyone.