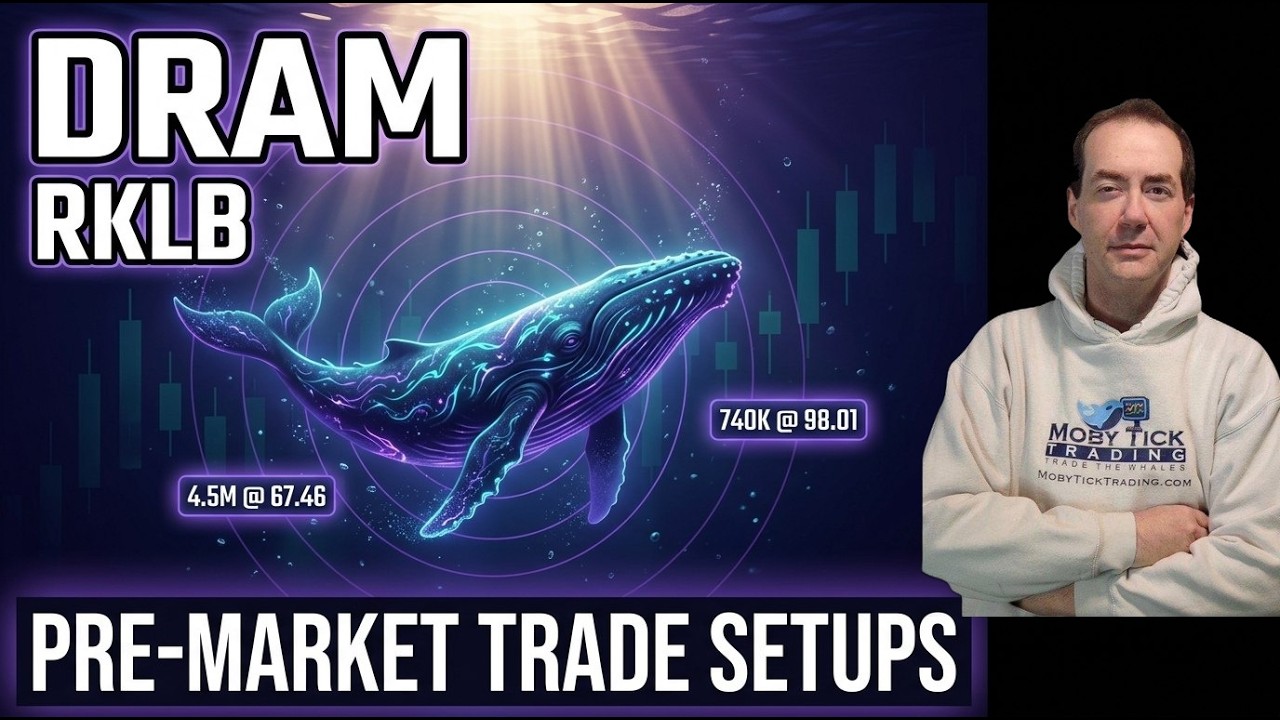
A trader analyzes dark pool prints in RKLB and DRAM to find where institutions are loading. RKLB shows a $740K print at $98.01 with bullish targets to $112.50. DRAM had a $4.5M print at $67.46, with upside targets to $80.
Chapters
Good morning, traders. It's Tuesday, June 30th at 4:18 a.m. All right, economic news today. We've got consumer confidence and the JOLTS job openings at 10. Put a vertical line on your chart so you don't forget, so you don't miss out on any volatility or get trapped. All right, two stocks for you today. We've got Rocket Lab and we've got DRAM. So let's go ahead and have a look here. So the market had pulled back like we had seen before. These are the largest trades in the last month, and you can see here on. Rocket Lab. The largest trade here is, I think, at $740K here at $98.01. So we're, we're just above that now. So let's look. It looks like we were pushing the price down here. Look at around June 3rd, we had these prints, we came back, more prints, consolidation of prints, pulled back. And then this is great for trade setups because look, right on the 100 simple moving average, we got another print here, $330K, held my 200 exponential on the daily, and now we're moving up through prints. So if we continue on and get above these prints around 109, 110, then Rocket Lab off to the races. Otherwise, if we break down below, we have retracement to this 100, down to this print, and then maybe test this 200. So let's map this out intraday. We are going to be bullish above 103.12. We got a 360K print like we just mentioned, so we want this to be Support. So if we come up, break above, break, retest, you need this to hold. Target 104, 104.88, 106, 106.48, 107, 108.08, 109 is this 360K print. But look at this, between this 50-cent level, that's 1.4, 1.5 million here, right at the 109 to 109.50 level. Then if we break above that, 110, 111.25, 112.50, 114. 111 is R3, and then above that we've got another 700,000 print. I stopped there. The ATR in this one's $9.82, so almost $10. Look at that. On the downside, we're going to be bearish below 101. Okay, so let's get below this here, 101. Target 155, 99.70, 98.86, 98.01 is 740K. 97.16, 96.32, and 95.65 stopped here at the pivot. So this bit of a staircase here, but I've got a 200 exponential, 200 simple, and a double pivot and cam. So stopping there for my callouts. This is massive support, plus we're above these prints now. So let's see what actually happens. Moving on to DRAM. So this is a memory ETF, and this has had lots of volume. Let's see, largest print here was 4.5 million June 24th, 67.46. We're at 72.32. So here June 1st, we had some prints pulled back, and then we got these big prints down here. And then look what actually happened. We tested it, tested it, inverted hammer. There's a test bar there. Then moving up with increasing volume, and then moved up more prints back to test the prints. You can see I always call this out so that you can see how the institutions are positioning here. The pull it back to add more, pull it back, and then looks like we're moving up from the four and the eight exponential moving average on the daily chart. So let's see if we can get up here to seventy-seven, eighty. And higher. Otherwise, if we break below, then we have some trades on the downside. So let's go ahead and have a look. We're going to be bullish above $72.50. We want this CAM here to be support. We're trying to— we're trying to break through. We're getting close. Target $72.95. $73.46 is a CAM. $73.80. $74.98 is a CAM. Then we've got $75.67. 76.50, 77.23 is this 1.1 million up here, and then 77.93 is a cam, and then I just put 80. This one has an ATR of about $6.23, so that's kind of what we would expect to get out of this one. Bearish below 70.75. Now this is way down here below this print It's difficult here because of the 200 exponential, 50 simple, and we've got this cam here. And then if we come down here, we've got the 200 simple in a print. So 70.75, we want to be below this target. 70.42, 70.14 is the pivot. Breaking below that, 68.90, 68.27 is S1, 68 is 1 million, 67.50 is 399K, and 4 cents from that is this 4.5 million, this largest trade that I pointed out. So this is like 4.8 million here. And notice the date, June 24th, June 29th. So 5 days later, we got another print on the, pretty much at the same level. And then below that, we've got 67, 66.50. 65.95, 64.61 is S2. And then if we lose S2, for example, then we can go to 62.50, 60.59.08 on that, on the downside. Okay, there you have it. Those are your 2 trade setups for today. So please like, share, subscribe, do all of that great stuff, and we'll see you tomorrow with all new trade setups. Happy trading. MobyTick has partnered with TrendSpider to bring real-time institutional trades to your charts. Click the link in the description below for more details.